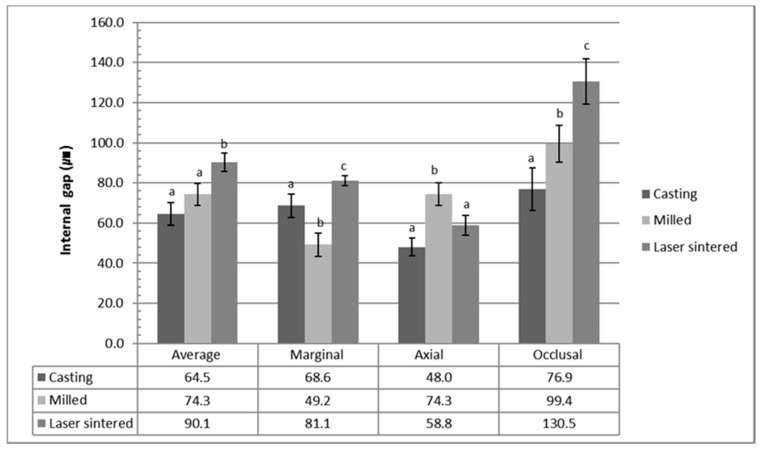
Figure 1.
The internal gap in the marginal, axial, and occlusal area for the casting, CAD/CAM milled, and laser sintered copings. The values represent the means and standard deviations (120 points/area of each group). The average internal gap values were calculated by the mean values of the marginal, axial, and occlusal area of each specimen in the group (5 measurements × 2 locations × 3 areas × 12 specimens × 3 groups, total 1080 points). The 3-D laser sintered group showed the highest average internal gap value which is significantly different from those of the casting and the CAD/CAM milled copings (p < 0.05). There was no significant difference between the casting and the milled group (p > 0.05).

