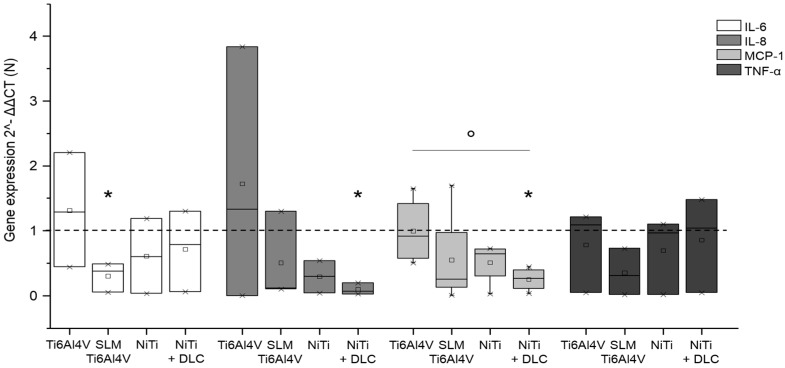
Figure 8.
Gene expression (IL-6, IL-8, MCP-1, and TNF-α) of human macrophages (n ≥ 3) after 96 h of cultivation on several test pellets (forged Ti6Al4V, Ti6Al4V SLM, NiTi, and NiTi + DLC). Boxes denote interquartile ranges, horizontal lines within the boxes denote medians, and whiskers denote minimum and maximum values. Data are normalized to the growth control (=100%, dotted line). For statistical analysis, ANOVA was conducted. A p-value < 0.05 was considered statistically significant. Comparison to growth control: * p < 0.05. Comparison between several test pellets: ° p < 0.05.

