For patients with stage II and III rectal cancer, much of the difference in survival between uninsured patients and those with insurance other than Medicaid can be explained by differences in treatment. Further efforts to determine the cause of residual differences as well as efforts to improve access to standard‐of‐care treatment for uninsured patients may improve population‐level survival for rectal cancer.
Keywords: Rectal cancer, Survival, Disparities, Insurance
Abstract
Background.
Rectal cancer (RC) is a common malignancy with a substantial mortality but good survival for patients with optimally treated nonmetastatic disease. Lack of insurance may compromise access to care and therefore compromise survival. Here, we examine RC survival by insurance type.
Methods.
Data from the Surveillance, Epidemiology, and End Results database were used to determine 1‐ to 3‐year survival for patients with RC by insurance type (Medicaid, uninsured, other insurance).
Results.
Patients with Medicaid or no insurance presented at later stages and were less likely to receive definitive surgery. Overall 3‐year survival was higher for patients with other insurance compared with Medicaid‐insured (+22.2% units) and uninsured (+18.8% units) patients. Major differences in survival were still observed after adjustment for stage. When patients with stage II and III RC were considered, 3‐year survival was higher for patients with other insurance versus those with Medicaid (+16.2% units) and uninsured patients (+12.2% units). However, when the analysis was limited to patients with stage II and III disease who received radiation therapy followed by definitive surgery, the difference decreased to +11.8% units and +7.3% units, respectively, for Medicaid and no insurance.
Conclusion.
For patients with stage II and III RC, much of the difference in survival between uninsured patients and those with insurance other than Medicaid can be explained by differences in treatment. Further efforts to determine the cause of residual differences as well as efforts to improve access to standard‐of‐care treatment for uninsured patients may improve population‐level survival for RC.
Implications for Practice.
Insurance status affects survival for patients with rectal cancer, but a substantial proportion of the difference in survival can be corrected if standard‐of‐care treatment is given. Every effort should be made to ensure that uninsured or publically insured patients receive standard‐of‐care treatment with as little delay as possible to improve patient outcomes.
Introduction
Colorectal cancer (CRC) is one of the most common cancers in the United States, with 132,700 cases and 49,700 deaths from this condition expected in 2015 [1]. It is generally considered a curable cancer when diagnosed before metastasis, and screening programs have led to decreases in both the incidence of CRC and the number of cases diagnosed at later stages [2], [3]. However, uptake of screening is suboptimal, especially among lower‐income patients, and late diagnosis is still an issue [4], [5].
Being uninsured and having only Medicaid insurance have been associated with poorer outcomes in several malignancies [6], [7], [8], including CRC [9], [10], [11]. However, prior studies have been limited by relatively small size or use of databases that are not truly population based. Recently, the Surveillance, Epidemiology, and End Results (SEER) database began including information about insurance status in its publicly available dataset. This provides the opportunity for study of the effects of insurance status on cancer survival in rare cancers and in detailed subgroup analyses in common cancers, such as CRC. However, one major limitation of the SEER database is lack of information on chemotherapy administration. This limits the ability of users to determine whether a specific disparity in outcome is related to treatment.
Rectal cancer (RC) has a different treatment recommendation compared with colon cancer. Specifically, for patients with stage II and III RC, neoadjuvant chemoradiotherapy is recommended before definitive resection of the primary tumor to reduce the risk for local recurrence, metastatic recurrence, and cancer death [12], [13]. Although the SEER database does not contain information on chemotherapy, it does provide information on surgery and radiotherapy, including sequence of therapy compared with surgery. Thus, analysis of RC survival and the contribution of treatment to survival disparity is possible.
Here, we examine survival for patients with RC in the early 21st century, controlling for insurance type, demographic characteristics, and treatment.
Materials and Methods
Data were extracted from the SEER18 database. This database includes data from 18 regional cancer registries throughout the United States. Registries are chosen for their high quality and epidemiologically significant populations. Together, the SEER registries draw on a base population of about 86 million people (about 28% of the total U.S. population) [14]. The population within the SEER registry is similar to the general U.S. population in most respects, although there are deliberate oversampling of some minority ethnic groups and a higher proportion of foreign‐born persons than in the general U.S. population [14]. In addition, it has been suggested that outcomes may be slightly better in the SEER registries than in the general population [15]. Patients with a diagnosis of RC or rectosigmoid cancer, selected by International Classification of Diseases, 10th Revision, codes C19 or C20, were included in the analysis.
Patients were categorized according to their insurance type, as per the SEER insurance recode variable, to Medicaid, no insurance, other insurance (including Medicare and private insurance), and information missing. According to the coding in the SEER database, insurance type was recorded at the time of initial diagnosis or treatment of the condition. Changes in insurance status are not recorded in the SEER database, and information on whether the insurance type was recorded at diagnosis or initial treatment is not available. Patients with Medicaid, Medicaid health maintenance organization, or Indian Health Services insurance were coded as “Medicaid.” Patients with private insurance, Medicare, any combination of Medicare plus supplemental insurance, or Veterans Affairs or military insurance were coded as “other insurance.” Patients without insurance or who were “self‐pay” were coded as “no insurance.” Patients who were coded as “insured‐no specifics” were included in the “other insurance” category. Because most patients age 65 years and older will be eligible for Medicare and therefore the rate of uninsured patients older than age 65 year is extremely small, the analysis was restricted to ages 15–64 years.
Case numbers and frequency of cases by stage versus insurance type as well as by treatment (radiation, surgery) versus insurance type were examined to determine whether insurance type influenced stage at presentation and whether insurance type influenced the probability that patients received standard‐of‐care treatment with respect to surgery and radiotherapy. Receipt of definitive surgery and radiotherapy, as well as sequence of therapy (i.e., whether radiation was given before or after surgery), was examined separately.
Complete analysis was used to determine 1‐, 2‐, and 3‐year survival by insurance status for patients diagnosed with RC in 2007–2012 and followed with respect to vital status until the end of 2012. Age‐specific and age‐standardized survival was estimated for point estimates of survival. Age standardization was performed according to the International Cancer Survival Standard [16] using three age groups (15–44, 45–54, and 55–64 years). In addition, we examined age‐standardized survival for patients with stage II and III RC overall and for those who were treated with radiation therapy before definitive surgery to determine the effect of receipt of standard‐of‐care treatment on survival by insurance type (i.e., whether a disparity would still be seen after adjustment for whether the patient had received standard‐of‐care treatment). Because resection of at least 12 lymph nodes (LN) is recommended for optimal assessment of tumor stage in colon and rectal cancer [17], the number of LN evaluated (0–11, ≥12, unknown/not recorded) was assessed as well. However, resection of at least 12 LNs can be difficult after radiation therapy, and thus some patients who receive neoadjuvant radiation therapy may have a limited number of LNs after appropriate surgical resection; this limits the usefulness of this measurement in rectal, as opposed to colon, cancer.
Most deaths in relatively young patients who are within 3 years of a diagnosis of RC are expected to be due to RC or related issues. However, it is well documented that people who live in poverty are at increased risk for death compared with those who do not [18], [19]. Therefore, RC‐specific survival was examined to determine whether differences in overall survival between different insurance types were related to the cancer or confounding issues. In RC‐specific survival, death from RC was counted as an event, whereas death from any other cause was counted as censoring. Because age, race, marital status, income, and gender, as well as stage and treatment, can affect the prognosis in patients with RC, a shared frailty model with log‐normal distributed frailty was used to estimate the effect of insurance on RC‐specific survival after adjustment for these variables. This model was used rather than the standard Cox proportional hazard model in order to take into account the possibility of clustering in income, which was estimated by using county‐level median household income data from the U.S. Census Bureau (accessed February 2016) [20]. Marital status was coded as “married” if the patient was married or in a domestic partnership and “unmarried” if the patient was single, separated, divorced, or widowed. The Cox proportional hazards assumption was assessed by adding a time‐dependent component for insurance status. No violation of the model assumption was observed.
All calculations were carried out by using SAS software, version 9.4 (SAS, Cary, NC, http://www.sas.com). Macros developed for population‐based survival analysis [21], [22] were used to estimate survival at 1–3 years after diagnosis. Statistical significance was tested two‐sided with α = .05 and no multiple comparison corrections.
Results
A total of 34,825 cases of RC were identified in the SEER18 database. Fifty‐six were identified by death certificate only, leaving 34,769 cases for analysis. Insurance information was missing for 2,014 cases (5.8%). These cases were included in the overall survival estimates but not in insurance‐specific analyses.
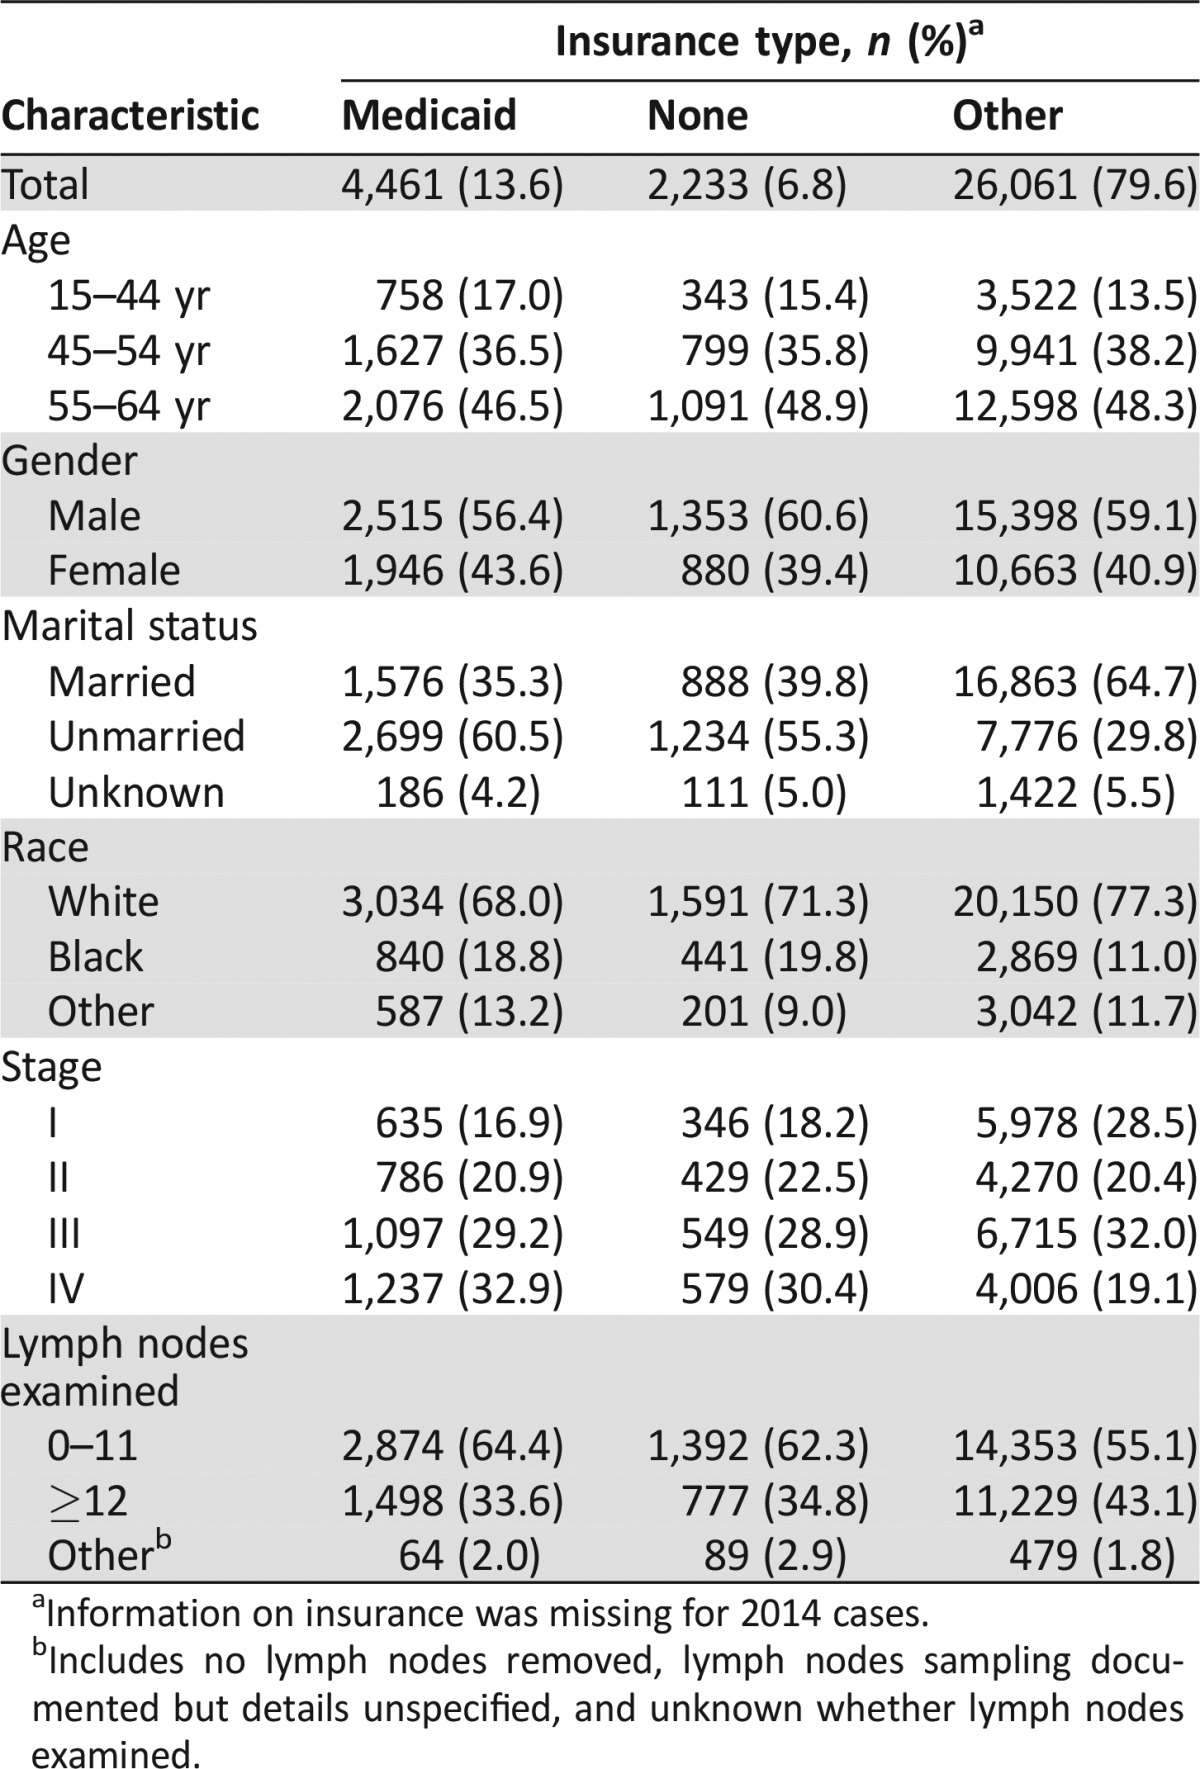
Approximately 14% and 7% of patients had Medicaid or no insurance, respectively (Table 1). Patients with Medicaid were slightly more likely to be in the 15‐ to 44‐year age group than were patients with other insurance. All insurance groups included more male than female RC patients. Blacks were overrepresented in the Medicaid and uninsured groups. Most patients with insurance other than Medicaid were married compared with only about 35%–40% of patients with Medicaid.
Table 1. Patient characteristics by insurance type.
Information on insurance was missing for 2014 cases.
Includes no lymph nodes removed, lymph nodes sampling documented but details unspecified, and unknown whether lymph nodes examined.
Uninsured patients and patients with Medicaid were less likely to have stage I cancer and more likely to have stage IV cancer compared with patients with insurance other than Medicaid. Patients with Medicaid or with no insurance were also more likely than those with other insurance to have fewer than 12 LNs examined and thus are at greater risk of being understaged (Table 1).
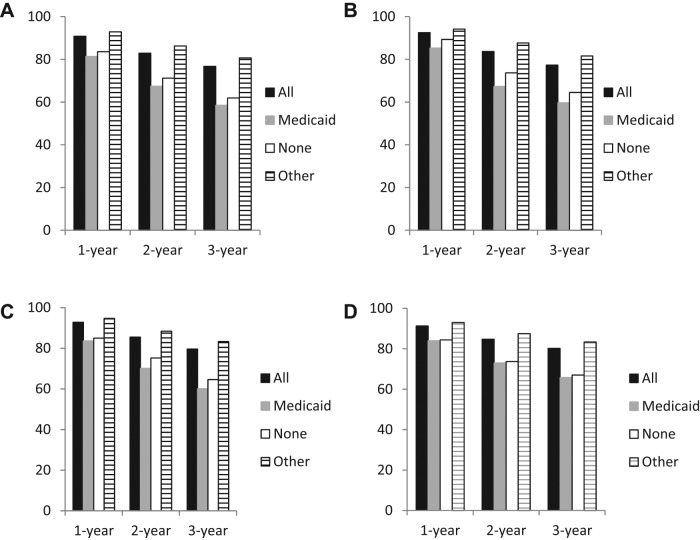
When overall 1‐, 2‐, and 3‐year survival was examined, survival was shorter for patients with Medicaid or without insurance, with age‐adjusted 3‐year absolute survival rates of 58.5%, 61.9%, and 80.7%, respectively, for Medicaid, no insurance, and other insurance (Fig. 1 and supplemental online Table 1). Large differences in survival were observed for patients without insurance and with Medicaid only versus those with other insurance for all ages and at 1, 2, and 3 years.
Figure 1.
Overall age‐adjusted and age‐specific 1‐, 2‐, and 3‐year survival for patients with rectal cancer by insurance type. (A): Overall age‐standardized survival. (B): Survival for ages 15–44 years. (C): Survival for ages 45–54 years. (D): Survival for ages 55–64 years.
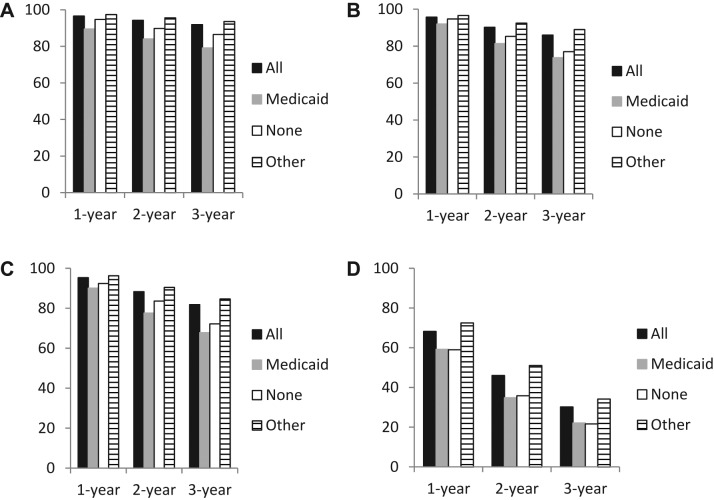
Stage‐specific survival was examined to determine the extent to which differences in stage could account for differences in overall survival. Estimates for 1‐, 2‐, and 3‐year survival were lower for uninsured patients and those with Medicaid only than for those with other insurance for each stage (Fig. 2 and supplemental online Table 2). As with the overall results, differences in survival were generally greater for longer time periods and survival was generally slightly lower for patients with Medicaid versus uninsured patients, with the partial exception of stage IV disease, for which differences in survival were greatest at 2 years. Survival differences ranged from +1.9 percentage units for 1‐year survival in patient with stage II disease for uninsured versus other insurance to +16.3 percentage units for 2‐year survival for Medicaid versus other insurance in patients with stage IV disease.
Figure 2.
Stage‐specific 1‐, 2‐, and 3‐year survival for patients with rectal cancer by insurance type. (A): Stage I. (B): Stage II. (C): Stage III. (D): Stage IV.
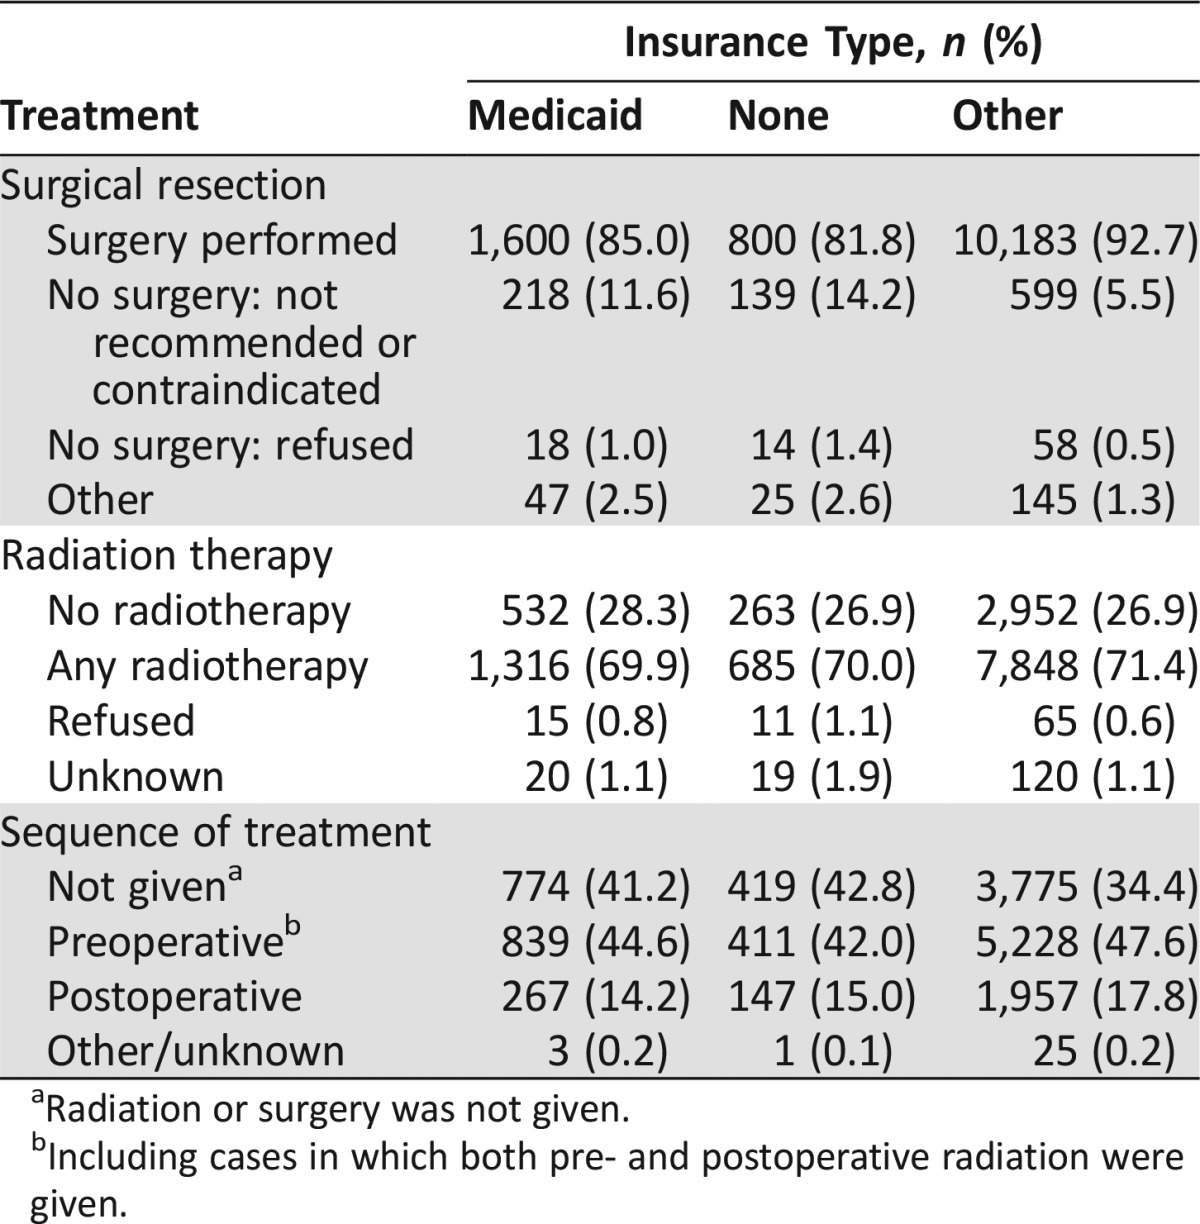
Frequency of treatment with surgery and radiation therapy, as well as sequence of radiation and surgery, was determined for patients with stage II and III RC (Table 2). Surgery was performed for 92.7% of patients with insurance other than Medicaid versus 85.0% of those with Medicaid and 81.8% of uninsured patients. Slightly more patients insured with Medicaid only or uninsured patients declined to undergo surgery compared with those with other insurance. Radiation therapy was given to 71.4% of those who had insurance other than Medicaid, 69.9% of Medicaid patients, and 70.0% of uninsured patients. When sequence of radiation and surgery was considered, 44.6%, 42.0%, and 47.6%, respectively, of patients with Medicaid, uninsured patients, and patients with other insurance received preoperative radiation therapy, including those who received both pre‐ and postoperative radiation. Although each individual difference in therapy between patients with Medicaid and uninsured patients versus those with other insurance was small, the combined differences in treatment were substantial.
Table 2. Treatment characteristics of patients with stage II and III rectal cancer by insurance type.
Radiation or surgery was not given.
Including cases in which both pre‐ and postoperative radiation were given.
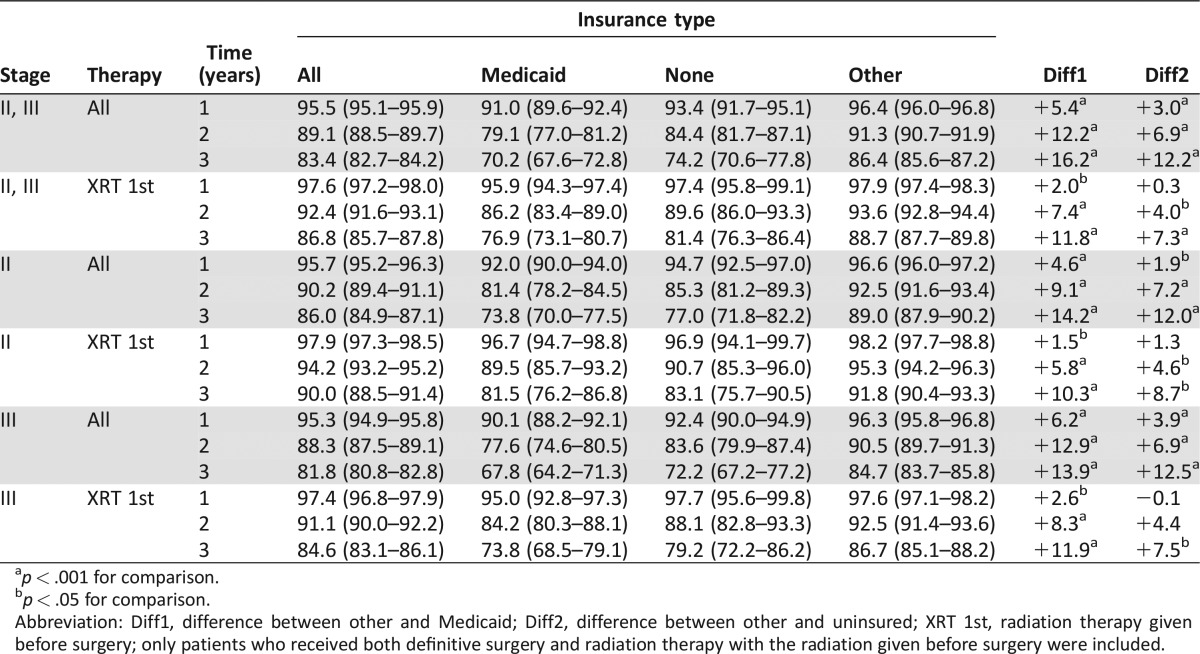
To determine the effect of treatment differences on survival, survival was calculated by insurance type for patients with stage II and III disease overall and only for patients who received surgery and preoperative radiation therapy (Table 3). As expected, survival was lower for those with Medicaid or with no insurance than for those with other insurance when all patients were included. However, when only patients treated with radiation before surgery were included, the differences in survival decreased slightly for those with Medicaid versus those with other insurance and decreased greatly for the uninsured versus those with insurance other than Medicaid. Results were similar when patients with stage II and III disease were analyzed separately, except for the slightly higher overall survival for stage II patients.
Table 3. Age‐standardized 1‐ to 3‐year survival (%) by stage, sequence of treatment, and insurance type for patients with stage II and III rectal cancer overall and those treated with radiation therapy before definitive surgery.
p < .001 for comparison.
p < .05 for comparison.
Abbreviation: Diff1, difference between other and Medicaid; Diff2, difference between other and uninsured; XRT 1st, radiation therapy given before surgery; only patients who received both definitive surgery and radiation therapy with the radiation given before surgery were included.
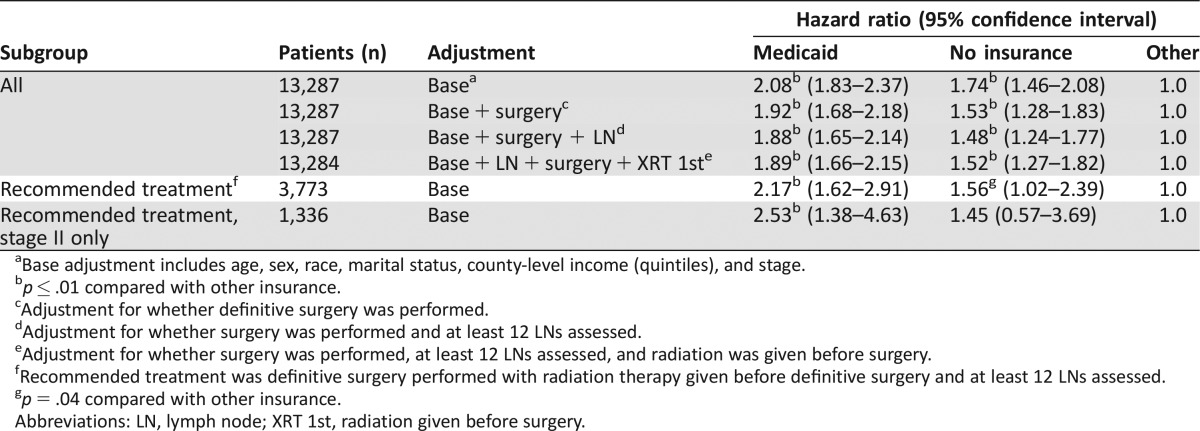
Hazard ratios (HRs) for RC‐specific survival by insurance type were calculated by using a shared frailty model for patients with stage II and III RC, examining both all cases and those treated optimally (i.e., with radiation therapy given before surgery). A total of 1,458 patients with stage II and III disease died, including 24 patients in whom the cause of death could not be determined; 1,127 deaths (77.3%) were recorded as due to RC. Cause of death was recorded as RC for 76.8%, 78.8%, and 79.2%, respectively, of patients with Medicaid, uninsured patients, and patients with other insurance. After adjustment for stage and basic demographic characteristics (age group, marital status, gender, race, income), patients with Medicaid and no insurance had an HR of 2.08 and 1.74, respectively, compared with those with other insurance (Table 4). After further adjustment for whether definitive surgery was performed, the HR decreased to 1.92 and 1.53, respectively, for Medicaid‐insured and uninsured patients. An interaction between treatment and insurance type was observed in the analysis. Therefore, a second analysis was performed that included only patients who appear to have received standard‐of‐care treatment. In this analysis, the HR for Medicaid actually increased to 2.17 and 1.56 for uninsured versus other, although the statistical significance of the difference between uninsured and other insurance was marginal for the latter. When only patients with stage II disease were considered, the HR for uninsured decreased to 1.45 and was no longer statistically significantly different from other insurance.
Table 4. Shared frailty hazard model to estimate effect of insurance on rectal cancer‐specific survival for stage II and III cancers overall, with different adjustments, and for patients who received the recommended treatment of radiation therapy followed by definitive surgery.
Base adjustment includes age, sex, race, marital status, county‐level income (quintiles), and stage.
p ≤ .01 compared with other insurance.
Adjustment for whether definitive surgery was performed.
Adjustment for whether surgery was performed and at least 12 LNs assessed.
Adjustment for whether surgery was performed, at least 12 LNs assessed, and radiation was given before surgery.
Recommended treatment was definitive surgery performed with radiation therapy given before definitive surgery and at least 12 LNs assessed.
p = .04 compared with other insurance.
Abbreviations: LN, lymph node; XRT 1st, radiation given before surgery.
Discussion
Patients who are insured with Medicaid only or are uninsured have lower survival expectations after diagnosis with RC compared with patients with other insurance. Patients with Medicaid only or no insurance are more likely to present with later‐stage disease but were also more likely to have a poor prognosis when stage was taken into account. When only patients with stage II and III disease were examined, survival continued to be poorer for those with Medicaid and without insurance, although demographic differences accounted for some of the differences between the groups. However, when only patients who were treated with radiation and then definitive surgery were considered, the disparity in overall and cause‐specific survival decreased substantially between uninsured patients and those with insurance other than Medicaid, although there continued to be a significant disparity for those with Medicaid versus other insurance. Multiple treatment factors appear to have played a role in the disparity between uninsured patients and those with insurance other than Medicaid, but the presence or absence of definitive surgery appears to account for the largest proportion of the difference in survival for stage II and III patients.
Socioeconomic status appears to be a risk factor for poor outcome in both CRC overall [9], [10], [11] and specifically in RC [9], [23]. One prior study examining outcomes in patients with RC using the National Cancer Database (NCDB) found HRs for death at 5 years of 2.05 and 2.01, respectively, for Medicaid patients and uninsured patients. After adjusting for stage and treatment, they found HRs of 1.34 and 1.29, respectively, with both values still being significantly different from the hazard of death for privately insured patients [9]. However, all cases in the NCDB come from patients treated at National Cancer Institute (NCI)‐designated cancer centers, whereas outcomes in the SEER database include patients treated outside of NCI‐designated centers. In addition, at least one study found that patients without insurance were less likely to be treated at an NCI‐designated center [24]. Thus, studies using the NCDB may underestimate the effect that lack of insurance has on cancer survival. A second study examining outcomes in a single institution found no differences in median survival by insurance type within the institution, although lower rates of sphincter preservation surgery and median survival were observed for patients with lower income [23]. Few patients in this study were uninsured. Finally, a prior study examining insurance status and survival using the SEER database showed overall results similar to ours, with presentation at higher stages and lower survival being found for uninsured and Medicaid patients with a variety of cancers [24]. However, although this study provided overview data for a wide variety of cancers, it did not focus on RC and contained little detail for any given cancer (i.e., it did not provide stage‐specific survival estimates and did not include detailed information on differences in survival by treatment).
Our data suggest that for patients who are uninsured at the time of diagnosis, differences in stage and access to treatment play major roles in the observed outcome disparities. Uninsured patients were less likely to present with stage I disease and more likely to present with stage IV disease, although the rate of presentation with stage II and III disease was only minimally different between uninsured and insured patients. Furthermore, uninsured patients were less likely to receive definitive surgery; slightly less likely to receive radiation; and, if they did receive both treatments, less likely to receive radiation before surgery. When survival was examined only for those who had received surgery and radiation in the recommended sequence, differences in survival and RC‐specific survival between uninsured patients and patients with insurance other than Medicaid was much attenuated. The reasons for the differences in treatment cannot be fully explored in the context of the SEER database because many relevant variables, including comorbid disease, are missing. However, the difference in treatment refusal between uninsured patients and those with insurance was minor, suggesting that patient nonadherence is not a major issue. Other studies have suggested that uninsured patients are less likely to be treated at NCI‐designated centers or high‐volume hospitals, possibly increasing the risk of patients receiving less than optimal care [25], [26].
In contrast, adjustment for available treatment information explained only a portion of the difference in survival and RC‐specific survival for patients with Medicaid, with a difference in survival being observed between patients with Medicaid and those with other insurance even when analysis was restricted to survival in stage II and III patients treated with radiation therapy before surgery. The reasons for this persistent discrepancy cannot be clarified through the data available in the SEER database. Other studies have suggested that patients with Medicaid may have more comorbid illness compared with those with private insurance [10], which would reduce their ability to tolerate appropriate therapy and decrease both overall and cause‐specific survival. Furthermore, one study found that patients who had discontinuous Medicaid enrollment before diagnosis, defined as not having Medicaid for at least 6 months prior to diagnosis, had worse survival and were less likely to undergo definitive surgery than those with continuous enrollment [27]. The SEER database reports only enrollment at time of diagnosis or start of treatment, and thus patients listed in SEER as “Medicaid” will be a mixture of continuously and discontinuously enrolled patients. The inclusion of both groups may lead to lower overall survival estimates in the Medicaid population.
Strengths of our study include the use of the SEER database, which provides population‐level data on cancer survival in a large population, thus allowing for a detailed examination of survival, including among relatively small subgroups. In addition, use of a population database allowed examination of the survival experience of patients in the “real world” as opposed to only those treated at specific institutions.
Several limitations should be considered in evaluating our results. First, the SEER database does not contain information on comorbidity status or use of chemotherapy; therefore, we cannot directly evaluate the effects of either of these factors on survival. Second, although the SEER database has fields for information on some biological markers of RC, including RAS mutational status and microsatellite instability, these fields are almost never filled and thus it is not possible to determine whether differences in the frequency of various biological markers of prognosis play any role in the observed differences in survival. Third, information on insurance status was missing in about 6% of cases.
Finally, insurance status is recorded at time of diagnosis or beginning of treatment and may change over time (e.g., uninsured patients may receive Medicaid when they are diagnosed with cancer, or patients with private insurance may lose their insurance). Thus, recorded insurance status may not reflect the patient's insurance status throughout the bulk of his or her treatment. It is very likely that a large percentage of patients recorded as uninsured were enrolled on Medicaid during treatment because it is almost impossible to receive outpatient cancer treatment without some form of insurance in the United States. Conversely, some of the patients who are recorded as Medicaid may have been enrolled in Medicaid only on diagnosis. It is notable that the number of patients recorded as having no insurance is lower than that which would be expected in the general population of adults under age 65 years in the United States; a recent census report stated that uninsured rates for individuals in the United States in 2013 were 13.3% overall and were as high as slightly over 30% in some age groups [28]. In contrast, our data showed an uninsured rate of 6.8%, suggesting that there may be a significant crossover of previously uninsured patients into Medicaid or other programs and, as noted earlier, patients who do not have continuous Medicaid before diagnosis may have a lower survival [27]. Alternately, the insurance distribution in the SEER areas may not be typical of that of the rest of the United States.
Conclusion
Differences in population‐level survival for uninsured patients with RC appear to be largely explained by differences in treatment, at least for stage II and III disease. These same differences in treatment explain only a minority of the disparity for Medicaid patients, but our data, taken along with data from other studies, suggest that differences in location of treatment, treatment type, and comorbid illness may explain some of the survival difference for this population. Further examination of population‐level survival, ideally with further information on treatment, comorbidity, and biological tumor characteristics, may be helpful in understanding the reasons for the continued disparity in patients with Medicaid versus other insurance. Most important, however, efforts to ensure that all patients, regardless of insurance status, receive state‐of‐the‐art screening and care are paramount and will result in reduced burden of rectal cancer both individually and on the population level.
Financial Support
Deutsche Krebshilfe Grant Number 108257 to HB, Deutsches Krebsforschungszentrum visiting scientist grant to DP.
See http://www.TheOncologist.com for supplemental material available online.
Author Contributions
Conception/Design: Dianne Pulte, Lina Jansen, Hermann Brenner
Collection and/or assembly of data: Lina Jansen, Hermann Brenner
Data analysis and interpretation: Dianne Pulte, Lina Jansen, Hermann Brenner
Manuscript writing: Dianne Pulte, Lina Jansen, Hermann Brenner
Final approval of manuscript: Dianne Pulte, Lina Jansen, Hermann Brenner
Disclosures
Dianne Pulte: DynaMed (C/A). The other authors indicated no financial relationships.
(C/A) Consulting/advisory relationship; (RF) Research funding; (E) Employment; (ET) Expert testimony; (H) Honoraria received; (OI) Ownership interests; (IP) Intellectual property rights/inventor/patent holder; (SAB) Scientific advisory board
Supplementary Information
References
- 1. Siegel RL, Miller KD, Jemal A. Cancer statistics, 2015. CA Cancer J Clin 2015;65:5–29. [DOI] [PubMed] [Google Scholar]
- 2. Stock C, Pulte D, Haug U, Brenner H. Subsite‐specific colorectal cancer risk in the colorectal endoscopy era. Gastrointest Endosc 2012;75:621–630. [DOI] [PubMed] [Google Scholar]
- 3. Kahi CJ, Myers LJ, Slaven JE et al. Lower endoscopy reduces colorectal cancer incidence in older individuals. Gastroenterology 2014;146:718–725. [DOI] [PubMed] [Google Scholar]
- 4. Guessous I, Dash C, Lapin P et al. Colorectal cancer screening barriers and facilitators in older persons. Prev Med 2010;50:3–10. [DOI] [PubMed] [Google Scholar]
- 5. Beydoun HA, Beydoun MA. Predictors of colorectal cancer screening behaviors among average‐risk older adults in the United States. Cancer Causes Control 2008;19:339–359. [DOI] [PubMed] [Google Scholar]
- 6. Pulte D, Jansen L, Brenner H. Survival disparities by insurance type for patients aged 15‐64 with non‐Hodgkin lymphoma. The Oncologist 2015;20:554–561. [DOI] [PMC free article] [PubMed] [Google Scholar]
- 7. Niu X, Roche LM, Pawlish KS, Henry KA. Cancer survival disparities by health insurance status. Cancer Med 2013;2:403–411. [DOI] [PMC free article] [PubMed] [Google Scholar]
- 8. Halpern MT, Ward EM, Pavluck AL et al. Association of insurance status and ethnicity with cancer stage at diagnosis for 12 cancer sites: A retrospective analysis. Lancet Oncol 2008;9:222–231. Last accessed December, 2015. [DOI] [PubMed] [Google Scholar]
- 9. Robbins AS, Chen AY, Stewart AK et al. Insurance status and survival disparities among nonelderly rectal cancer patients in the National Cancer Data Base. Cancer 2010;116:4178–4186. [DOI] [PubMed] [Google Scholar]
- 10. Robbins AS, Pavluck AL, Fedewa SA et al. Insurance status, comorbidity level, and survival among colorectal cancer patients age 18 to 64 years in the National Cancer Data Base from 2003 to 2005. J Clin Oncol 2009;27:3627–3633. [DOI] [PubMed] [Google Scholar]
- 11. Roetzheim RG, Pan N, Gonzalez EC et al. Effects of health insurance and race on colorectal cancer treatments and outcomes. Am J Public Health 2000;90:1746–1754. [DOI] [PMC free article] [PubMed] [Google Scholar]
- 12. Nussbaum N, Altomare I. The neoadjuvant treatment of rectal cancer: A review. Curr Oncol Rep 2015;17:434. [DOI] [PubMed] [Google Scholar]
- 13. Dobie SA, Warren JL, Matthews B et al. Survival benefits and trends in use of adjuvant therapy among elderly stage II and III rectal cancer patients in the general population. Cancer 2008;112:789–799. [DOI] [PMC free article] [PubMed] [Google Scholar]
- 14.Surveillance, Epidemiology, and End Results (SEER) Program . Research Data (1973‐2012), National Cancer Institute, DCCPS, Surveillance Research Program, Cancer Statistics Branch. Released April 2015, based on the November 2014. submission. Available at: http://www.seer.cancer.gov. Accessed December, 2015.
- 15. Mariotto A, Capocaccia R, Verdecchia A et al. Projecting SEER cancer survival rates to the US: An ecological regression approach. Cancer Causes Control 2002;13:101–111. [DOI] [PubMed] [Google Scholar]
- 16. Corazziari I, Quinn M, Capocaccia R. Standard cancer patient population for age standardizing survival ratios. Eur J Cancer 2004;40:2307–2316. [DOI] [PubMed] [Google Scholar]
- 17. Smith AJ, Driman DK, Spithoff K et al. Guideline for optimization of colorectal surgery and pathology. J Surg Oncol 2010;101:5–12. [DOI] [PubMed] [Google Scholar]
- 18. Singh GK, Siahpush M. Widening socioeconomic inequalities in US life expectancy 1980‐2000. Int J Epidemiol 2006;35:969–979. [DOI] [PubMed] [Google Scholar]
- 19. Clarke CA, Miller T, Chang ET et al. Racial and social class gradients in life expectancy in contemporary California. Soc Sci Med 2010;70:1373–1380. [DOI] [PMC free article] [PubMed] [Google Scholar]
- 20.U.S: Census Bureau. American Community Survey , 2014. Community Survey. Median Income in the Past 12 Months (2010‐14). Available at: https://www.census.gov/library/publicaions.2015.html. Last accessed December, 2015.
- 21. Brenner H, Gefeller O, Haklinen T. Period analysis for “up‐to‐date” cancer survival data: Theory, empirical evaluation, computational realization and applications. Eur J Cancer 2004;40:326–335. [DOI] [PubMed] [Google Scholar]
- 22. Brenner H, Hakulinen T. Up‐to‐date and precise estimates of cancer patient survival: Model‐based period analysis. Am J Epidemiol 2006;164:689–696. [DOI] [PubMed] [Google Scholar]
- 23. Nitzkorski JR, Willis AI, Nick D et al. Association of race and socioeconomic status and outcomes of patients with rectal cancer. Ann Surg Oncol 2013;20:1142–1147. [DOI] [PubMed] [Google Scholar]
- 24. Walker GV, Grant SR, Guadagnolo BA et al. Disparities in stage at diagnosis, treatment, and survival in nonelderly adult patients with cancer according to insurance status. J Clin Oncol 2014;32:3118–3125. [DOI] [PMC free article] [PubMed] [Google Scholar]
- 25. Huang LC, Ma Y, Ngo JV et al. What factors influence minority use of National Cancer Institute‐designated cancer centers? Cancer 2014;120:399–407. [DOI] [PMC free article] [PubMed] [Google Scholar]
- 26. Huang LC, Tran TB, Ma Y et al. Factors that influence minority use of high‐volume hospitals for colorectal cancer care. Dis Colon Rectum 2015;58:526–532. [DOI] [PMC free article] [PubMed] [Google Scholar]
- 27. Dawes AJ, Louie R, Nguyen DK et al. The impact of continuous Medicaid enrollment on diagnosis, treatment, and survival in six surgical cancers. Health Serv Res 2014;49:1787–811. [DOI] [PMC free article] [PubMed] [Google Scholar]
- 28. Smith JC, Medalia C. Health insurance coverage in the United States : 2014. Current Population Reports. U.S. Census Bureau. September 2015. Available at: https://www.census.gov/library/publicaions.2015.html. Accessed on December 2015.
Associated Data
This section collects any data citations, data availability statements, or supplementary materials included in this article.


