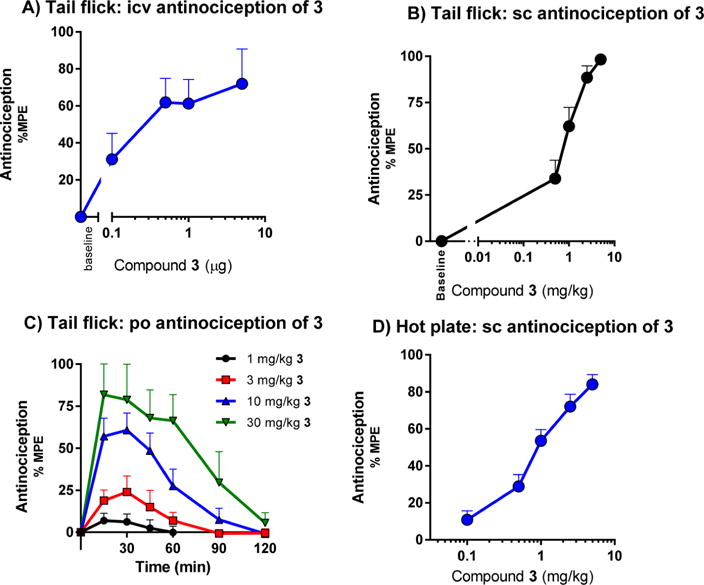
Figure 4.

Antinociception of compound 3 upon intracerebroventricular, subcutaneous, and oral administration. (A) Dose–response curves of antinociception of 3 and morphine given supraspinally in CD1 mice. Two independent determinations of the cumulative dose–response curves were performed on groups of mice (n = 5) for antinociception in the tail flick assay with 3 intracerebroventricularly. Animals were tested 15 min later at peak effect to generate the analgesic dose–response curve. Each point represents mean ± SEM for 10 mice. ED50 values (and 95% CI) were 0.38 (0.18- 0.81) μg for 3. (B) Dose–response curves of antinociception of 3 given subcutaneously in CD1 mice. Three independent determinations of the cumulative dose–response curves were performed on groups of mice (n = 10) for antinociception in the tail flick assay, 30 mice in total. ED50 (and 95% CI) = 0.76 (0.56–0.83) mg/kg. (C) Time course of tail flick antinociception of 3 given orally in CD1 male mice. Groups of mice (n = 10) were given different doses of 3 orally by gavage and tested for analgesic response at the indicated time points. ED50 (and 95% CI) = 7.5 (4.3–13) mg/kg. (D) Hot plate. Groups of CD1 mice (n = 10) were assessed for antinociception of 3 at peak effect in two independent experiments (n = 20 total) in a cumulative dose–response paradigm. Analgesia was determined using a 55 °C hot plate, where the latency to respond with a hind paw lick or shake/flutter, whichever came first, was recorded. ED50 (and 95% CI) = 0.99 mg/kg (0.75–1.3).
