
Figure 7.
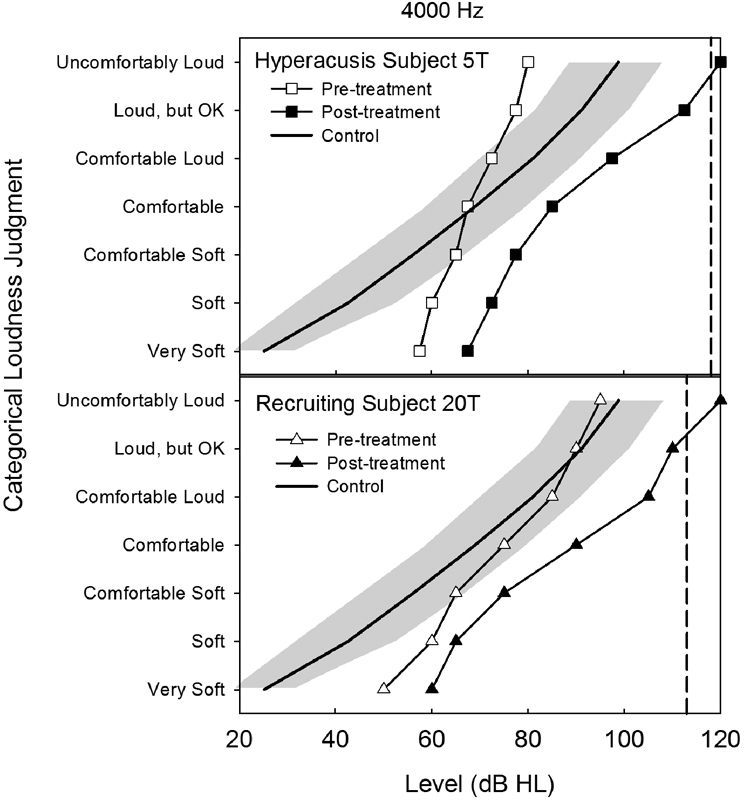
Pre- and posttreatment loudness-growth functions are shown in the top and bottom panels, respectively, for the 4,000-Hz warble tone condition for hyperacusis participant 5T (outcomes profile shown in Fig. 3) and for loudness recruitment participant 20T (outcomes profile shown in Fig. 4). The dashed vertical line in each panel denotes the predicted LDLcrit for normal sound tolerance for that participant based on a mathematical model (see Eq. 1) described by Hawley et al.23 Posttreatment LDLs for both of these participants exceeded their normal sound tolerance predictions at 4,000 Hz. The average control function (±1 standard deviation denoted by the shaded region) represents the mean loudness-growth response measured at 4,000 Hz from 10 typical normal-hearing listeners described in this issue by Hawley et al.56 Abbreviation: HL, hearing level.