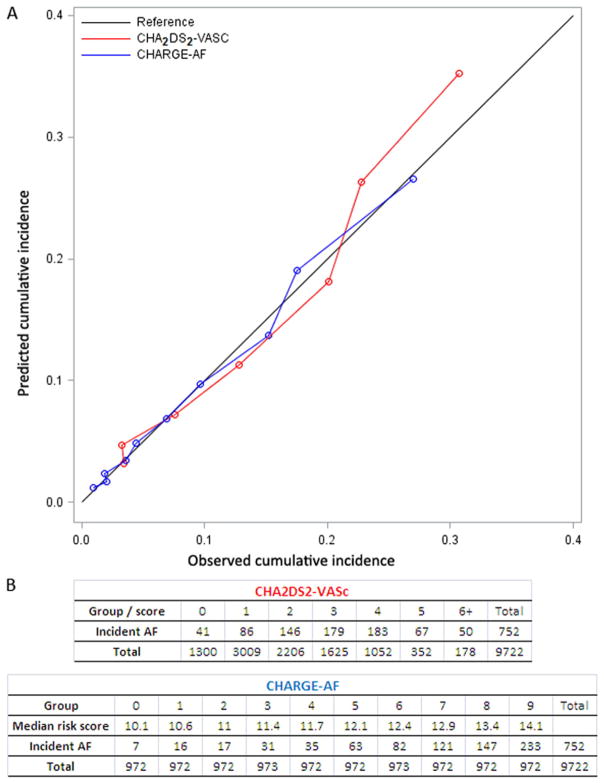
Figure 3.
Calibration curves for the CHARGE-AF and the CHA2DS2-VASc risk scores. We calculated the predicted cumulative incidence and the empirically estimated (the observed) incidence within each subgroup defined by either score. A, Comparison of the predicted values (red for CHA2DS2-VASc, blue for CHARGE-AF) and the observed cumulative incidence. The black diagonal is the reference. A shorter distance from the dots to the reference line indicates better calibration. B, The tables show the groups used for the Hosmer-Lemeshow calibration, including number of incident AF cases and total number, for each risk score. The lower rows show number of follow-up windows.

