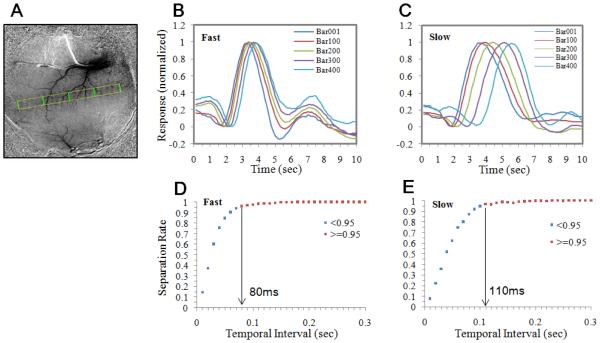
Figure 4.
Estimation of temporal resolution limit. The data set is from the same case as shown in Figure 2 and 3. A. A negative undershoot frame (the 10-second frame in Figure 2A) was used to illustrate the trajectory of the moving dot (yellow rectangle). Five equally-spaced lines (green lines) were selected in V1. The response timecourses of the pixels underlying these lines were calculated from fast and slow spot conditions and shown in B and C, respectively. Traces were normalized to amplitude of rebound peak minus initial dip peak. The timecourses at different points along the trajectory show similar temporal shapes and systematic shifts in the time axis. Multiple pairs having the same temporal separation can be selected from the trajectory and used for calculating the probability of successful separation. D & E: The percentage of the pairs having the same temporal separation (X axis) that their timecourses are statistically separable. For fast moving dots, over 95% of pairs separated by 80ms can be separated. For slow moving dots, this value is larger (110ms). See text for details.

