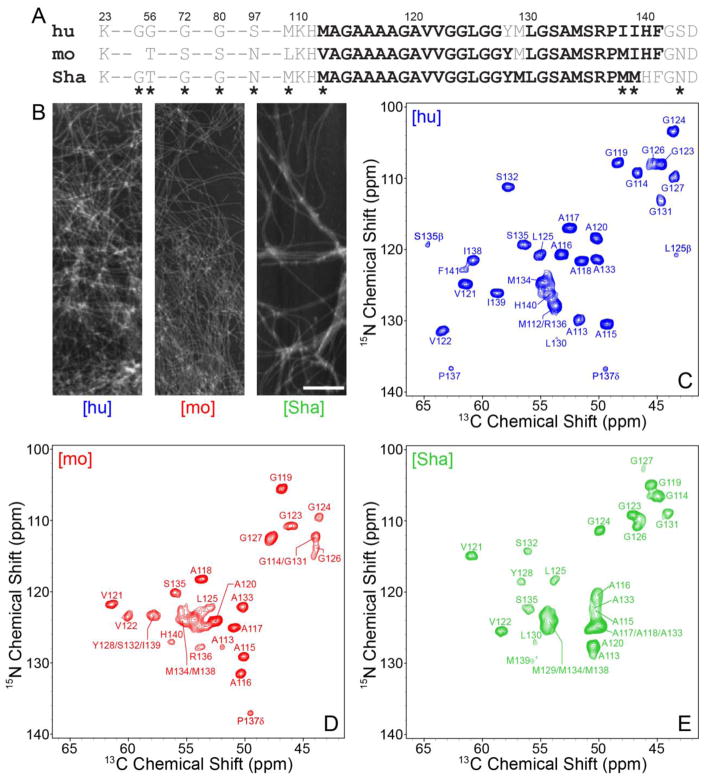
Fig. 1.
(A) Amino acid sequences of hu, mo and ShaPrP23-144. Immobile amyloid core residues detectable in the solid-state NMR spectra are shown in bold black font and conformationally flexible residues are shown in grey font. Residues that are not conserved between the hu, mo and ShaPrP23-144 sequences are indicated by asterisks. (B) Representative atomic force microscopy images of [hu], [mo], and [Sha] amyloid fibrils used for the solid-state NMR measurements. The scale bar corresponds to 1 μm. (C–E) Assigned two-dimensional 500 MHz 15N-13C solid-state NMR spectra of (C) [hu], (D) [mo] and (E) [Sha] amyloid fibrils recorded at 11.111 kHz MAS. Each spectrum was recorded with acquisition times of 15 ms (t1, 15N) and 28 ms (t2, 13C), and a total measurement time of ~24 hours. Cross-peaks are drawn with the lowest contour at ~15 times the root mean square (rms) noise level.

