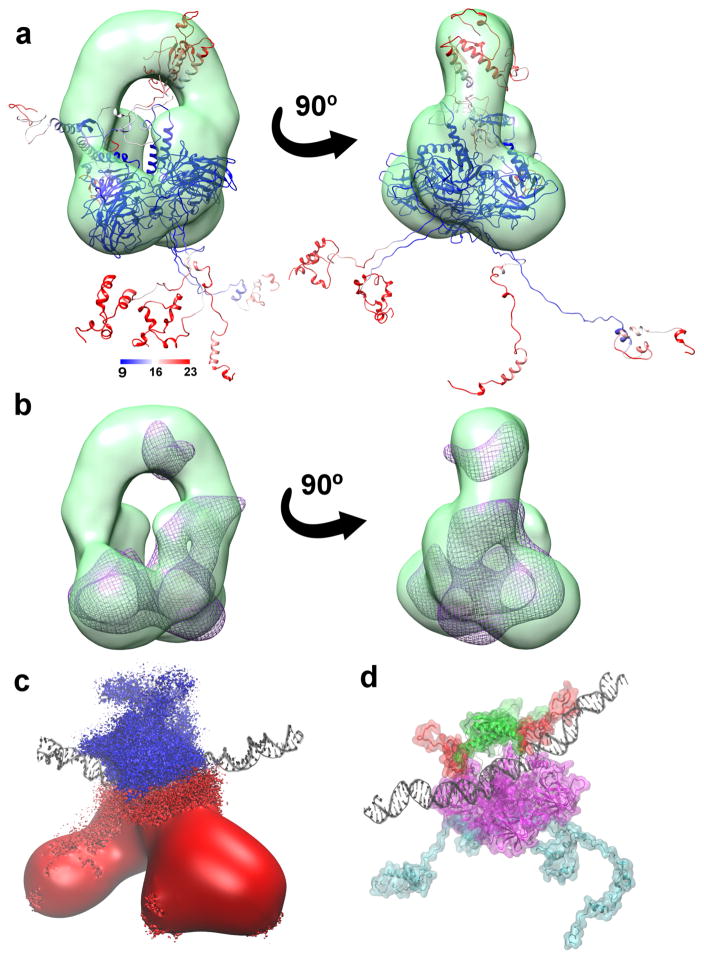
Figure 2. Full-length p53 global conformational change.
a) A representative fl-p53 structure colored based on RMSF values and fitted into the class III EM map (depicted in green surface representation) from Melero et al28 b) The simulated density map depicted as a purple wireframe surface fitted into the same EM map in panel a. c) Ensemble-averaged electrostatics map for fl-p53 tetramer. Negative electrostatic isosurface drawn at -4 kT/e is colored in red and positive electrostatic isosurface drawn at +4 kT/e is shown in blue. DNA is depicted as black ribbons for reference. d) The p53 C-terminals, highlighted in red, interacting with the DNA, depicted as black ribbons. NTD, linkers, DBD and TET were colored in cyan, black, magenta, and green, respectively.

