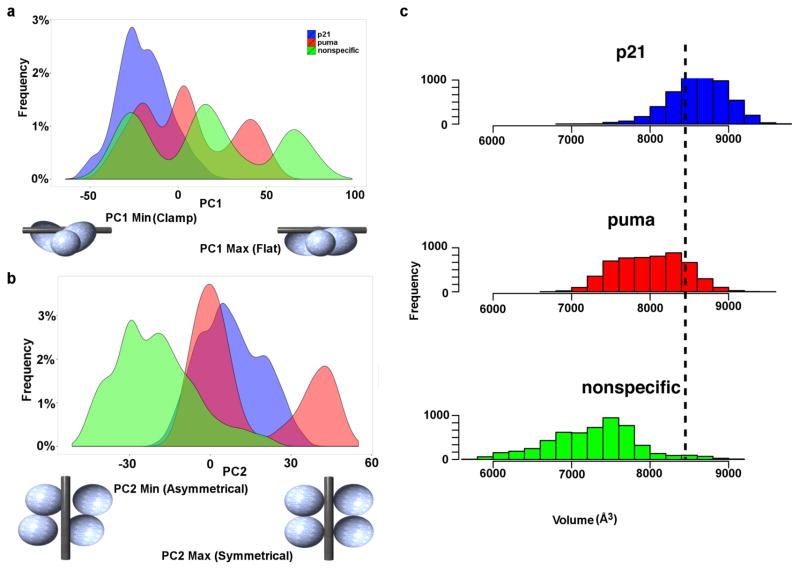
Figure 3. Quaternary DBD binding modes.
Histograms showing the a) PC1 and b) PC2 distributions of each system. p21, puma, and the nonspecific DNA system distributions are colored in blue, red and green, respectively. The binding modes corresponding to the minimum and maximum values of PC1 and PC2 are drawn in cartoon underneath each x-axis. c) Histogram showing the distribution of the grab volume between the four DBDs during simulations of each system. The black dashed line demonstrates the initial grab volume value prior to the simulations.

