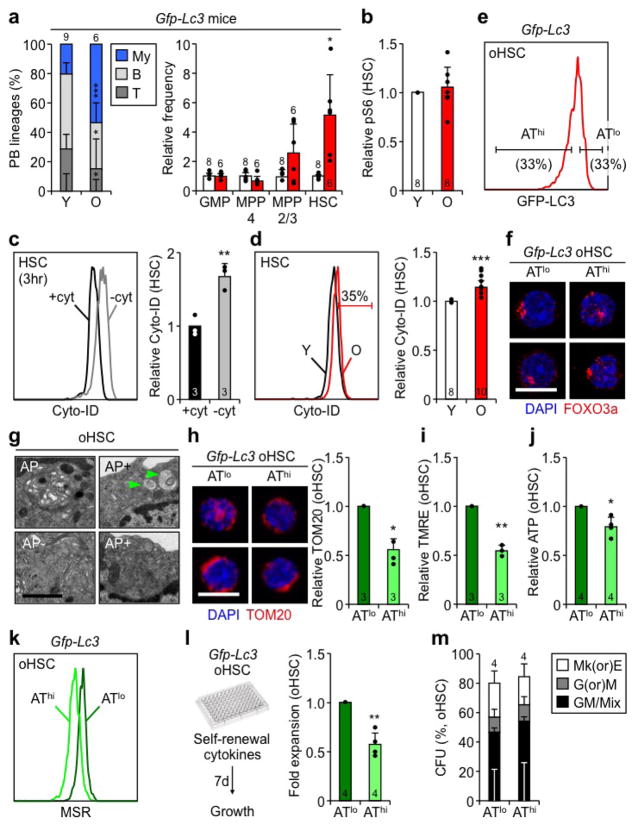
Extended Data Fig. 7. Additional analyses of old Gfp-Lc3 HSCs.
a, Lineage distribution in PB (left) and frequency of the indicated populations (right) in young and old Gfp-Lc3 mice (related to Fig. 5a, b). b, pS6 levels in young and old HSCs. c, d, Representative FACS plots and quantification of Cyto-ID dye levels in (c) HSCs cultured for 3hr ± cyt, and (d) young and old HSCs. e, Representative FACS plots of autophagy low (ATlo) and autophagy high (AThi) oHSC subsets. f, Representative examples of 3 independent experiments showing IF staining of FOXO3a in ATlo and AThi oHSCs; scale bar, 10 μm. g, Representative EM micrographs of oHSCs ± autophagosomes (AP) showing vesicles (top) and ER/Golgi (bottom) compartments; scale bar, 1 μm. h, Representative IF staining and quantification of TOM20 in ATlo and AThi oHSCs; scale bar, 10 μm. i–j, Characteristics of ATlo and AThi oHSCs: (i) TMRE levels, (j) ATP levels, and (k) ROS levels measured by Mitosox Red (MSR) staining. l, Expansion of ATlo and AThi oHSCs in self-renewal culture conditions. m, Colony formation in methylcellulose from ATlo and AThi oHSCs; CFU: colony-forming unit; Mk(or)E and G(or)M: mature megakaryocyte, erythroid, granulocyte or macrophage colonies; GM/Mix: immature GM or GMMkE colonies. Results are expressed as percent of 100 plated cells. Data are mean ± S.D., and are expressed relative to +cyt HSC (b), yHSC (c, e), or ATlo oHSC (h–j, l) levels. *p ≤ 0.05, **p ≤ 0.01, ***p ≤ 0.001.

