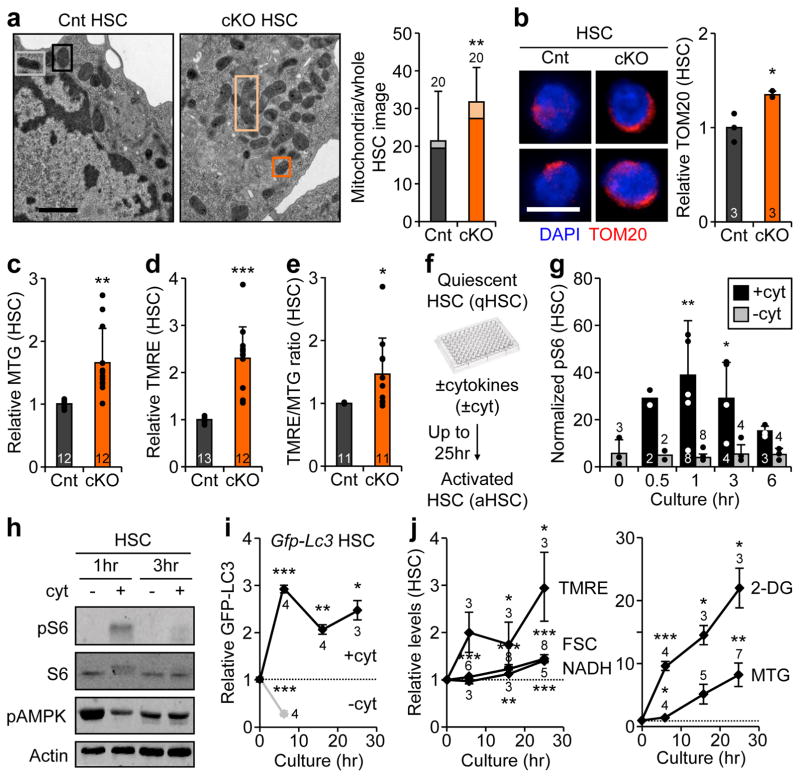
Figure 2. Mitochondrial characteristics in autophagy-deficient and activated HSCs.
a, Representative EM micrographs and quantification of total, normal (dark box) and elongated (light box) mitochondria in Cnt and cKO HSCs; scale bar, 1 μm. Statistical significance is for all three parameters, n indicate cell numbers. b, Representative TOM20 IF staining and quantification of mitochondria in Cnt and cKO HSCs. c–e, Mitochondria parameters in Cnt and cKO HSCs: (c) MTG levels, (d) TMRE levels, and (e) TMRE/MTG ratio. f–j, in vitro HSC activation: (f) experimental scheme (hr: hour); (g) pS6 levels measured by flow cytometry (results are normalized to IgG levels); (h) pS6, total S6, and pAMPK levels measured by Western blot (actin is used as loading control); (i) GFP-LC3 levels (n = 6 for 0hr; ± S.E.M.); and (j) mitochondrial parameters (n = 6 (TMRE), 10 (FSC), 7 (NADH), 4 (2-DG) and 7 (MTG) at 0hr; ±S.E.M.). Data are mean ± S.D. except when indicated, and are expressed relative to Cnt HSC (a-e) or 0hr HSC (g, i, j) levels. *p ≤ 0.05, **p ≤ 0.01, ***p ≤ 0.001.

