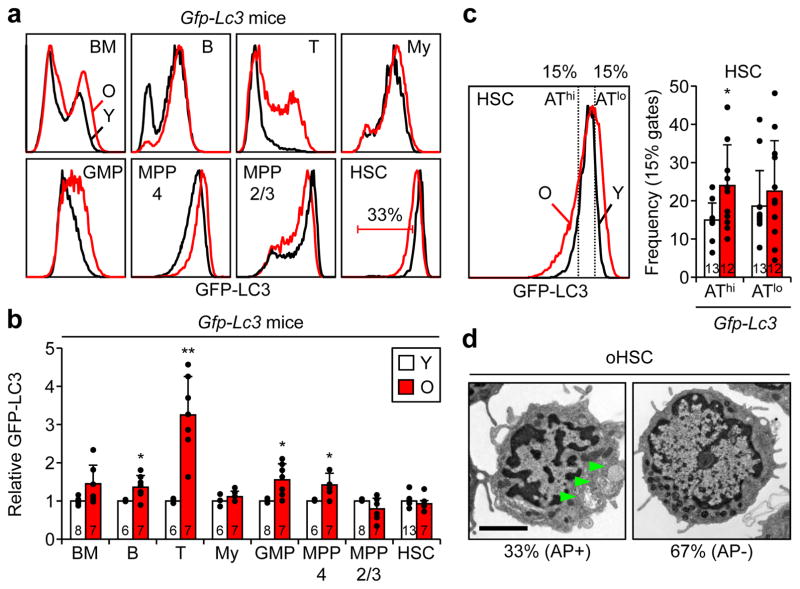
Figure 5. Different autophagy activity in aged hematopoietic populations.
a, b, Autophagy levels measured in young and old Gfp-Lc3 mice: (a) representative FACS plots, and (b) quantification of GFP-LC3 expression. Results are expressed relative to the respective young populations. c, Representative FACS plots and frequency of young and old HSCs within the 15% GFP-LC3 low/autophagy high (AThi) and 15% GFP-LC3 high/autophagy low (ATlo) yHSC gates. d, Representative EM micrographs and percent of oHSCs ± autophagosomes (AP, arrowheads) (58 cells total); scale bar, 2 μm. Data are means ± S.D. *p ≤ 0.05, **p ≤ 0.01, ***p ≤ 0.001.

