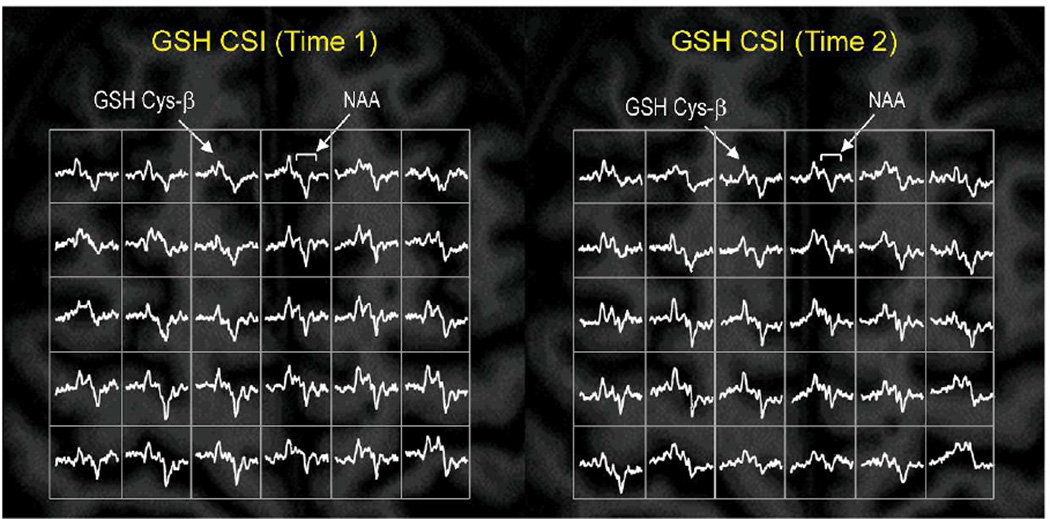
Figure 1. Longitudinal mapping of GSH in the brain of a patient with SPMS.
Partial views of the in vivo mapping of GSH show consistent detection of GSH signals in the brain of a patient with SPMS at the initial scan (Time 1, left) and at the follow-up scan (Time 2, right) at 3 T. The data were acquired from the same patient who was clinically stable during the study period of 43 months. The GSH CSI acquisition parameters of Time 1 and Time 2 were identical: slice thickness = 3 cm, matrix size = 8 × 8, FOV = 20 × 20 cm2, TE/TR = 115/1500 ms, spectral width = 2 kHz, and number of averages = 12). GSH CSI data were overlaid on the corresponding anatomical MR images from the middle of the CSI slab. Nominal spatial resolution of the CSI was 1.25 × 1.25 × 3 cm3 after 1 × zero padding.

