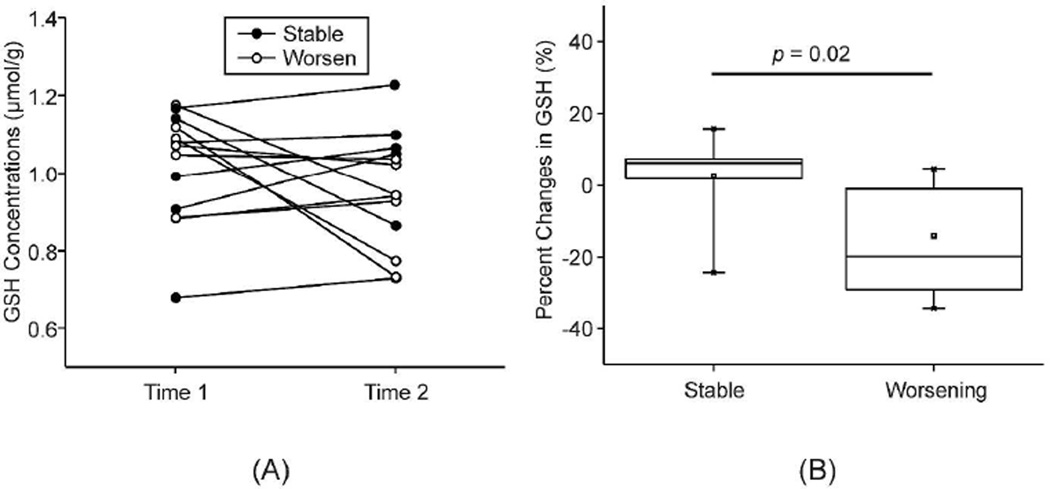
Figure 2. Longitudinal change in brain GSH and clinical status of patients with SPMS.
(A) GSH concentrations in the frontal region at Time 1 and Time 2 are shown for each patient distinguished according to stable or worsening clinical status. (B) Box plot for the percentage change in frontal GSH concentrations is depicted for patients with stable (n=7) versus worsening (n=6) clinical status over the 3–5 year interval between Time 1 and Time 2, based on the neurologists’ blinded appraisal. The percentage changes of stable and worsening subgroups were compared using a nonparametric statistical test (Mann-Whitney U test).

