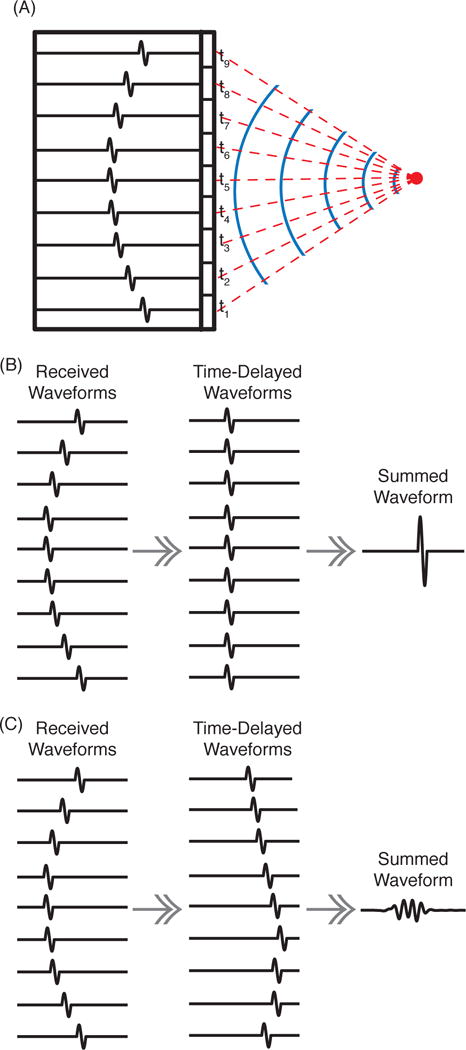
Fig. 1.

(A) An acoustic pulse is emitted from a point source (red circle). The solid blue lines represent wavefronts. The red dashed lines indicate the acoustic propagation paths, each with a corresponding time of flight, ti. The black outlined rectangles schematically represent the array elements. The recorded waveforms for each element are shown as a single-cycle pulse arriving at different times. (B) When corresponds to the source location and is used to compute the time delays to shift the waveforms, the waveforms will sum constructively. (C) When is a location away from the source, the time-delayed waveforms do not add constructively and the summed waveform has a lower amplitude and less energy.
