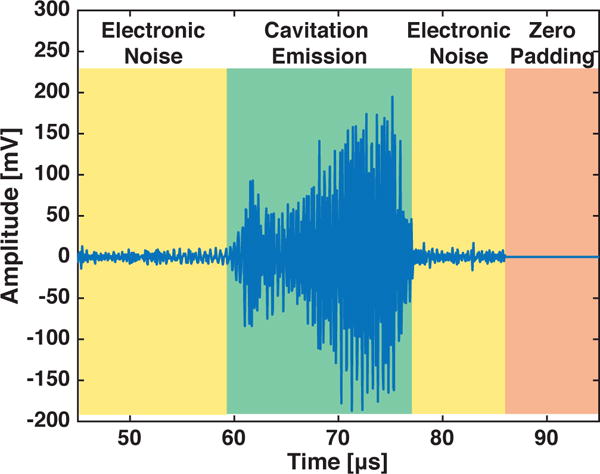
Fig. 3.

An example recorded signal is shown. The signal includes times when only electronic noise was measured by the system (yellow shading), when zero padding as a post-processing step was implemented (orange shading), and when cavitation emissions were recorded (green shading). Only the green shaded region would be including when determining TIOI.
