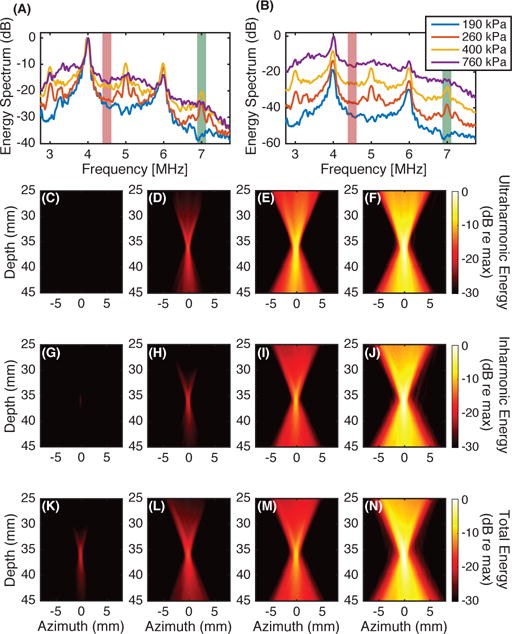
Fig. 4.

Microbubbles were insonified with a 2 MHz pulse of duration 14.4 μs at one of four different pressure amplitudes. The computed energy spectra at the location of the pixel with the maximum amplitude in passive cavitation images is shown (A, B). The energy spectra are plotted on a decibel scale relative to the energy at 4 MHz for each insonation pressure amplitude (A) or relative to the energy at 4 MHz for the 760 kPa insonation (B). Passive cavitation images were formed for each insonation pressure amplitude from the energy at the ultraharmonic frequency of 7 MHz, shown with green shading [(C), (D), (E), (F), respectively] and the inharmonic frequency of 4.5 MHz shown with red-orange shading [(G), (H), (I), (J), respectively]. For comparison, subfigures (K), (L), (M), and (N) are formed using a time-domain algorithm, which beamforms all frequencies. For a given bandwidth, each image was normalized by the maximum energy in the image formed from data obtained while insonifying with a 760 kPa peak rarefactional pressure amplitude.
