
Table 3. Comparative analysis of SF-36 quality of life scores.
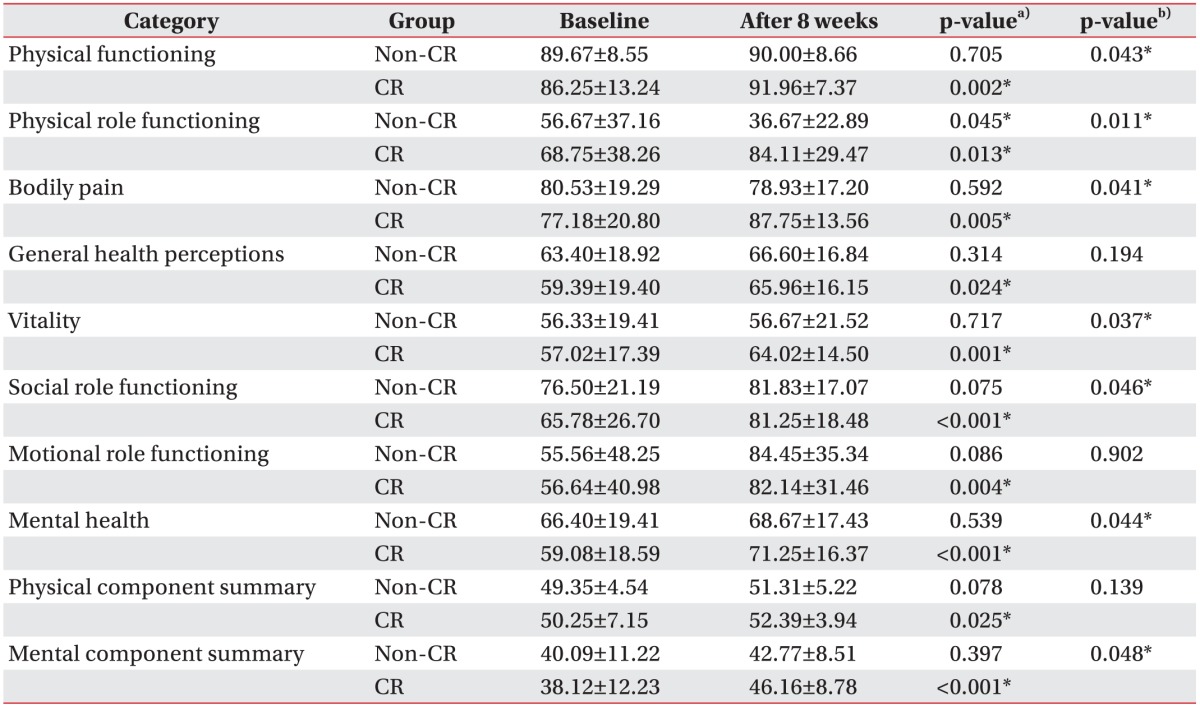
Values are presented as mean±standard deviation.
CR, cardiac rehabilitation.
a)p-value in a single group by paired t-test. b)p-value between the two groups by independent t-test.
*p<0.05.