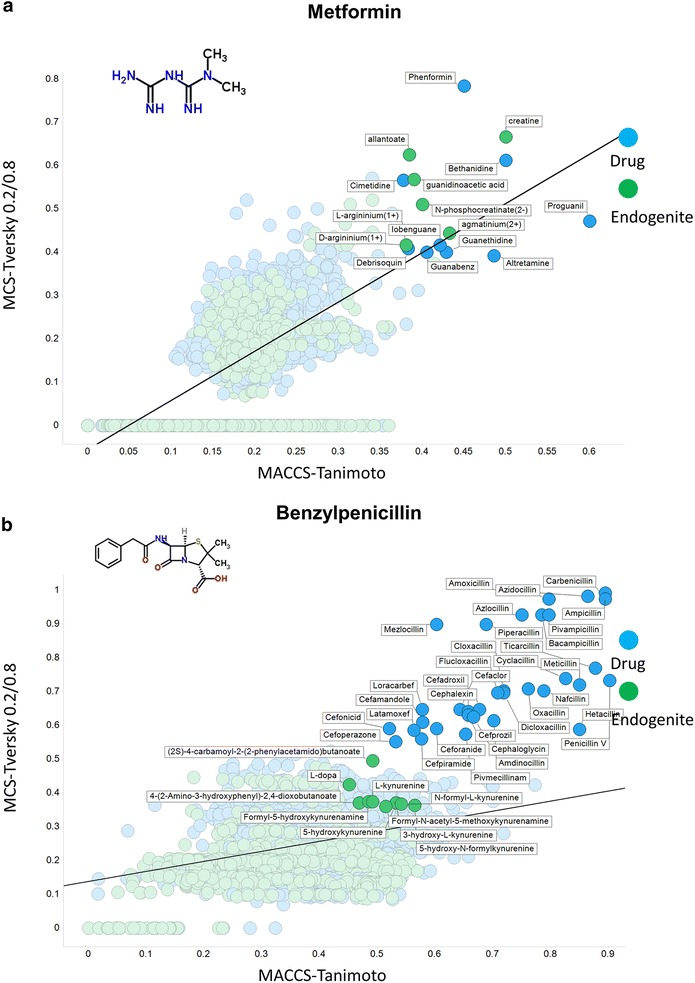
Fig. 5.

Relationship between MCS encoded as a Tversky similarity (α, β = 0.2, 0.8) and MACCS-encoded Tanimoto similarity from selected drugs with other marketed drugs (blue) and endogenous metabolites (green), highlighted at an arbitrary ‘break’ for each class and where the numbers involved were small enough to permit legibility. The straight lines are those of best fit. a Metformin. b Benzylpenicillin
