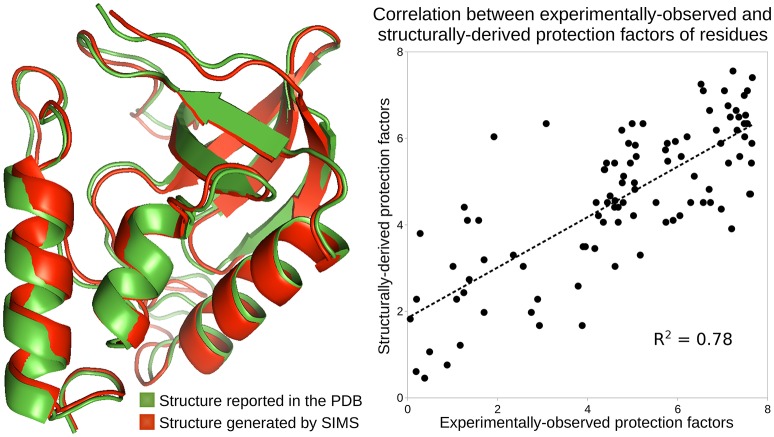
Figure 2.
Analysis of the native state of SN. Conformations of SN are depicted using the ribbon model: the conformation reported in the PDB, in green, and the conformation generated by SIMS which provides estimates of protection factors that best fit the experimental HDX data, in red. The plot shows the correlation between the experimentally-observed HDX data and the HDX data derived from the SIMS conformation. The correlation coefficient is 0.78.

