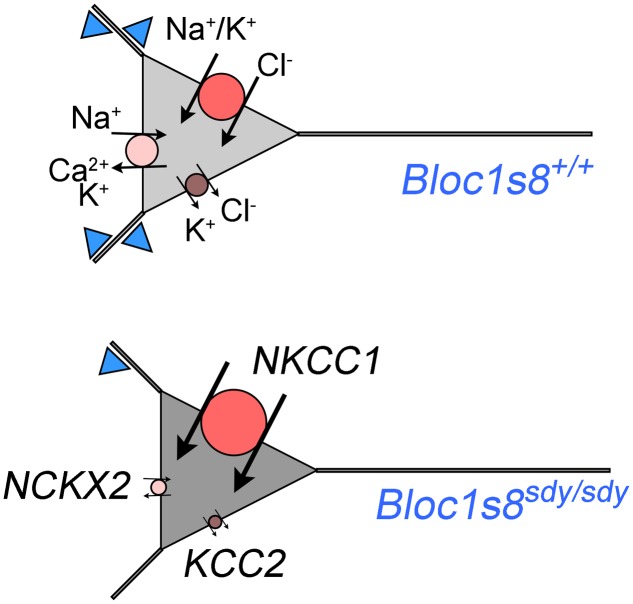
FIGURE 7.
A model of phenotypes downstream of GABA interneurons in dysbindin null developing hippocampus. Diagram depicts a model of wild type and Bloc1s8sdy/sdy neuron innervated by parvalbumin-positive GABA terminals (blue triangles) at postnatal day 7. The Bloc1s8sdy/sdy mutation decreases the number of GABA cells and synapses (reduced blue triangles). Changes in the expression of NKCC1, KCC2, and NCKX2 are represented by the size of the circle. Arrows depict direction of ion flows. The shade of gray represents predicted intracellular chloride concentration, note an increased concentration of intracellular chloride in Bloc1s8sdy/sdy neurons due to changes in expression in transporters expression.

