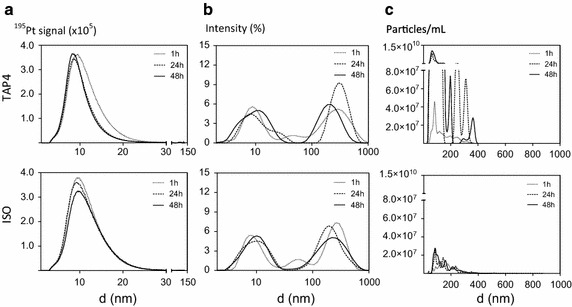
Fig. 1.

Influence of incubation periods and media on size distributions determined by different methods. Size distributions after different incubation periods (1–48 h) for Pt nanoparticles suspended in TAP4 (4× diluted tris–acetate-phosphate) medium (top row) and ISO medium (bottom row) determined by different methods. a Suspensions of 4 mg Pt/L analyzed by Asymmetric Flow Field-Flow Fractionation (AsFlFFF); b Suspensions of 30 mg Pt/L analyzed by Dynamic Light Scattering (DLS); c Suspensions of 80 mg Pt/L analyzed by Nanoparticle Tracking Analysis (NTA).
Reprinted with permission from Sørensen et al. [78]. Copyright (2016) American Chemical Society
