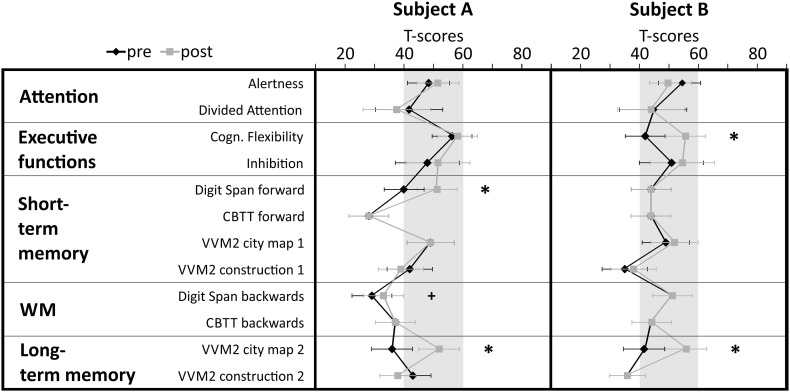
Fig. 1.
Test performance is expressed in T-scores with population mean M = 50 and standard deviation SD = 10. Single subject test scores and confidence intervals for measurements of attention, executive functions, short- and long-term memory, and working memory (WM) performed during the pre- and post-assessment are depicted separately for stroke patient A and B. Significant differences between pre- and post-test (critical difference analysis on the group level, Huber 1973) are marked with asterisks (*significant, +marginally significant). CBTT corsi block tapping test, VVM visual and verbal memory test

