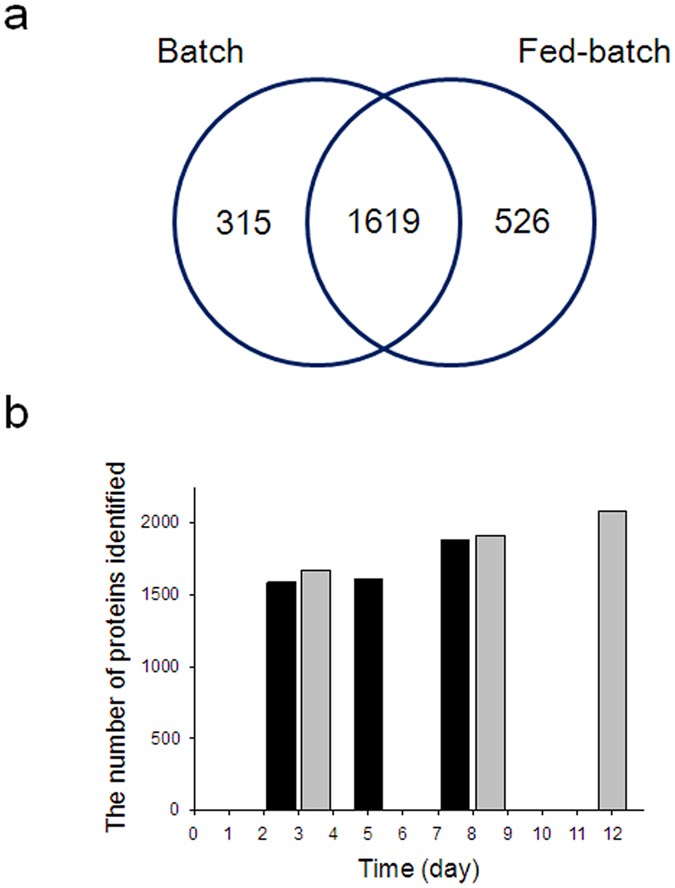
Figure 4. Number of identified HCPs in the culture supernatants during batch and fed-batch cultures.

(a) Venn diagram representing total number of proteins. (b) The number of identified HCPs in the culture supernatants during batch (black) and fed-batch cultures (gray).
