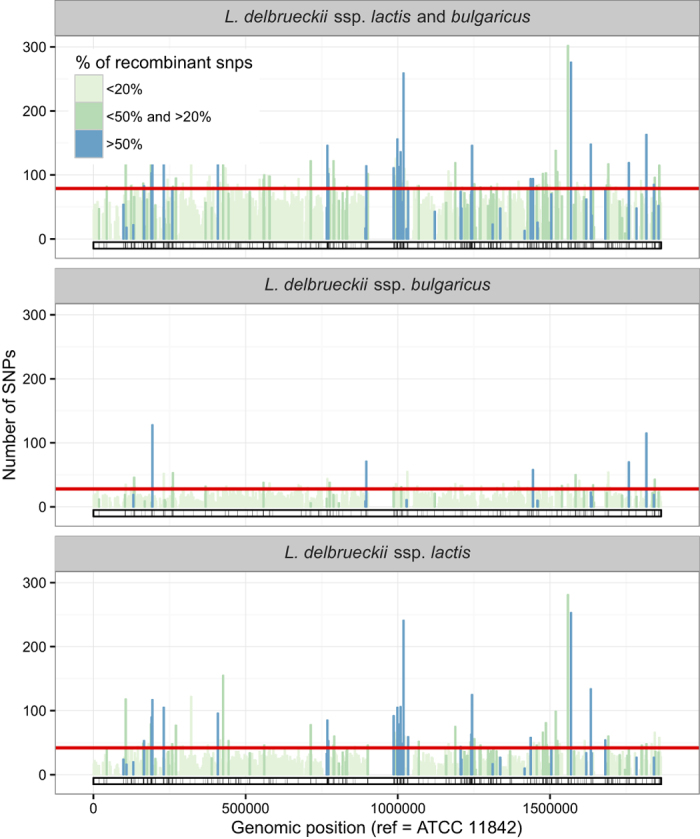
Figure 2. Local density of SNPs along the core-genome.

SNPs are counted over non-overlapping windows of 2.5 kbp. The fraction of recombinant SNPs is computed by averaging the probabilities of being recombinant over all SNPs in the window and color-coded. The red lines indicate the SNP count thresholds: counts above the threshold indicate that the window contains more SNPs than expected by chance if the SNPs were uniformly distributed (p < 0.05 after fdr correction for multiple testing). Empty zones correspond to regions not belonging to the core genome of L. delbrueckii. SNP counts and fraction of recombinant SNPs are computed from the complete core genome of the 10 L. delbrueckii strains (top panel), of the 5 L. delbrueckii ssp. bulgaricus strains (middle panel), or of the 5 L. delbrueckii ssp. lactis strains (bottom panel). The barcode at the bottom of each panel highlights the fragments detected as recombinant (black) in at least one strain of the corresponding strain set.
