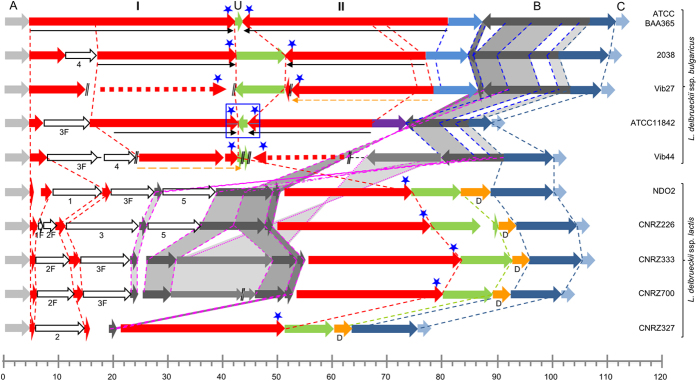
Figure 3. Schematic representation of replication terminus regions of 10 L. delbrueckii genomes.
(A) “anchor” sequence, identical in all genomes; I, left-hand repeat; U, unique central sequence; II, right-hand repeat (in strain ATCC BAA365). Parts of I and II that are underlined with black arrows constitute the IR in the respective ssp. bulgaricus strains. Thin-lined orange arrows indicate duplicated regions (sequencing depth two times higher than adjacent regions) in strains Vib27 and Vib44 (cf Fig. 5). Dotted red arrows indicate probable positions of the duplicate regions. The blue rectangle indicates the approximate position of the replication terminus in the ATCC 11842 genome5. Blue stars indicate positions of putative dif sites. //, separation between two sequence scaffolds. Region (B) is translocated to the opposite replichore in the ssp. lactis compared to the ssp. bulgaricus. Identical colors indicate homology between strains. 1, 2, 3, 4, and 5 indicate additional regions of homology, where (F) indicates that only a part (Fragment) of the sequence is present. Scale, size (kbp).

