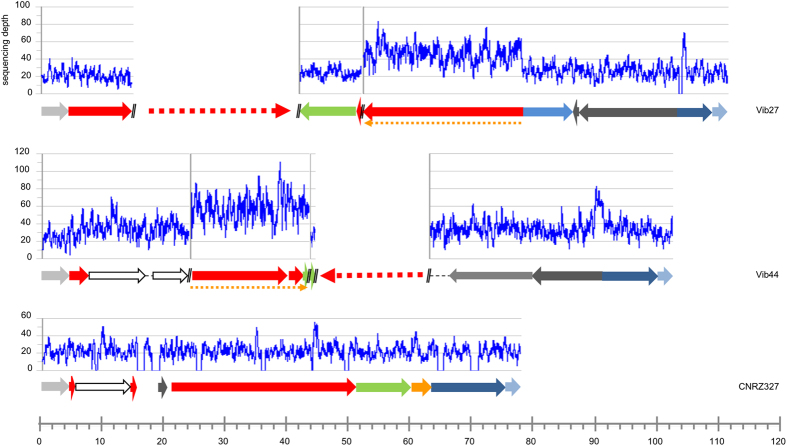
Figure 4. Sequencing depth in the vicinity of the replication terminus of the Vib27, Vib44 and CNRZ327 genomes.
Schematic representation of the replication terminus regions of L. delbrueckii ssp. bulgaricus strains Vib27 and Vib44 and L. delbrueckii ssp. lactis strain CNRZ327; see Fig. 3 for details. //, separation between two sequence scaffolds. Graphs represent sequencing depth after whole genome sequencing (454 paired-end sequencing, Roche Life Sciences). Orange dotted lines indicate regions where sequencing depth is twice as high as in surrounding regions, indicating that these regions are repeated in the respective chromosomes. Horizontal scale, size (kbp).

