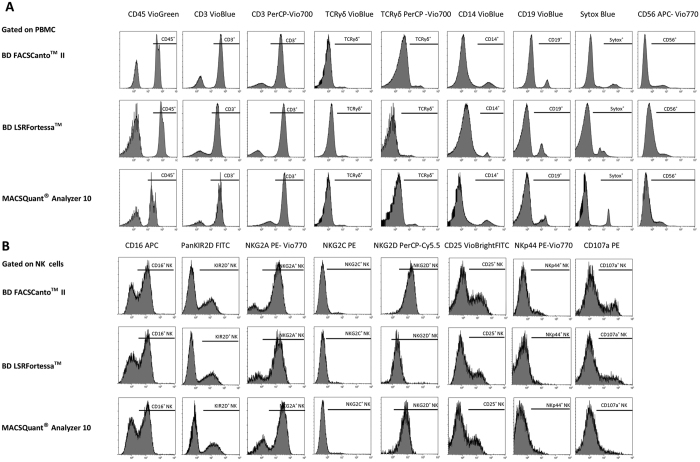
Figure 2. Comparison of FACS panels antibody fluorochrome intensities between three flow cytometers.
All antibodies in the NK cell phenotype and function panel were tested for their fluorochrome intensities using the same staining and acquisition protocols on three different flow cytometers. Single stains from backbone antigens were evaluated for their antigen expression levels. PBMC were gated on NK cells for detecting NK receptors and NK functional antigens in the drop-in channels. One representative set of histograms (n = 3) is shown for each marker tested at three different centers using three different flow cytometers. Antigen expression is expressed as percentage of positive cells for backbone antibodies in (A) and for NK cell drop ins in (B).

