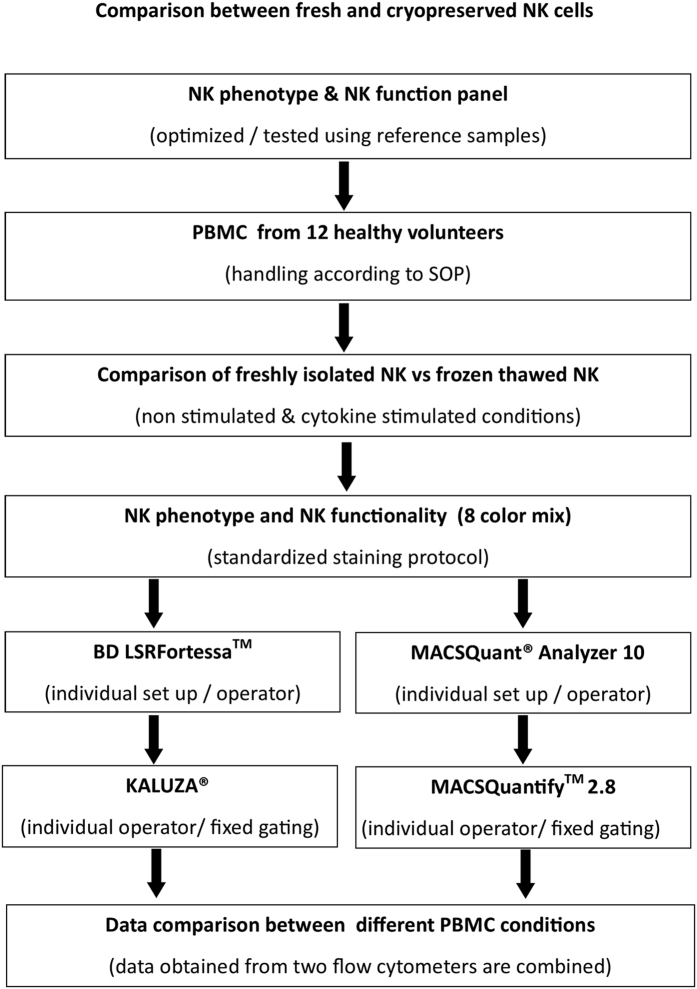
Figure 4. Experimental design to compare different PBMC conditions.
The experimental set up describes the work flow to compare NK phenotype and function changes under different PBMC (non-stimulated and stimulated) conditions. PBMC from 12 healthy donors were stained with NK cell phenotype and NK function panel cocktails. Data was acquired for 6 donors using BD LSRFortessaTM and for other 6 donors in MACSQuant® Analyzer 10. Further, FCS files from LSRFortessaTM were analysed on KALUZA® and for MACSQuant® Analyzer 10 in MACSQuantifyTM 2.8. Data obtained from both devices were combined and examined for statistical significance between fresh and cryopreserved NK cells.

