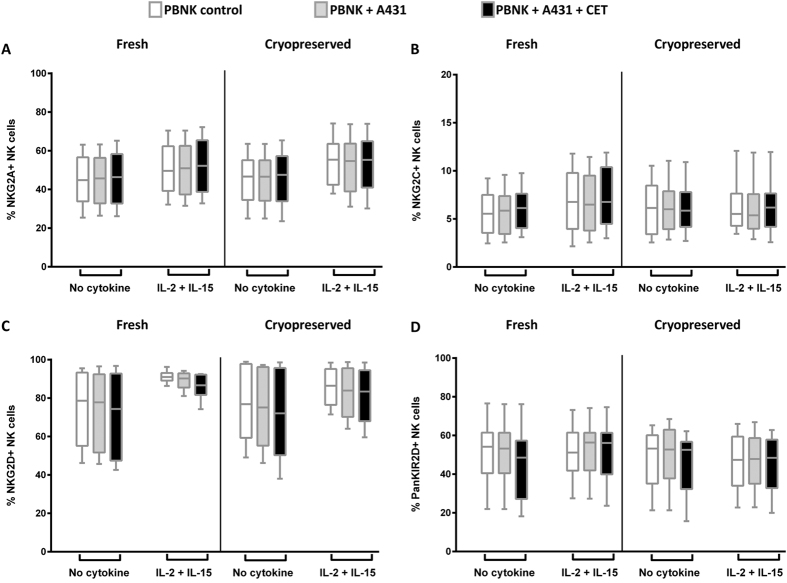
Figure 5. Comparison of NK cell phenotypes between fresh and cryopreserved NK cells.
NK cell phenotypes between freshly isolated and cryopreserved thawed PBMC samples were compared. NK cells were either activated or non-activated with cytokines (IL-2+IL-15) and target cells (A431) alone or targets coated with cetuximab (CET). Expression levels of NKG2A (A), NKG2C (B), NKG2D (C), KIR2D (D) were compared for the following conditions: i) NK only ii) NK+A431 and iii) NK+A431+CET conditions. NK only conditions are depicted as open rectangles, followed by NK+A431 with grey shades and NK+A431+CET conditions represented as black rectangles. Columns represent data from12 donors, from each donor the mean of triplicate values was used; with bars showing SEM. Data are from independent experiments performed in triplicates from 12 PBMC donors (6 donors: BD LSRFortessa +6 donors: MACSQuant). Statistical analysis was performed using the Wilcoxon test.

