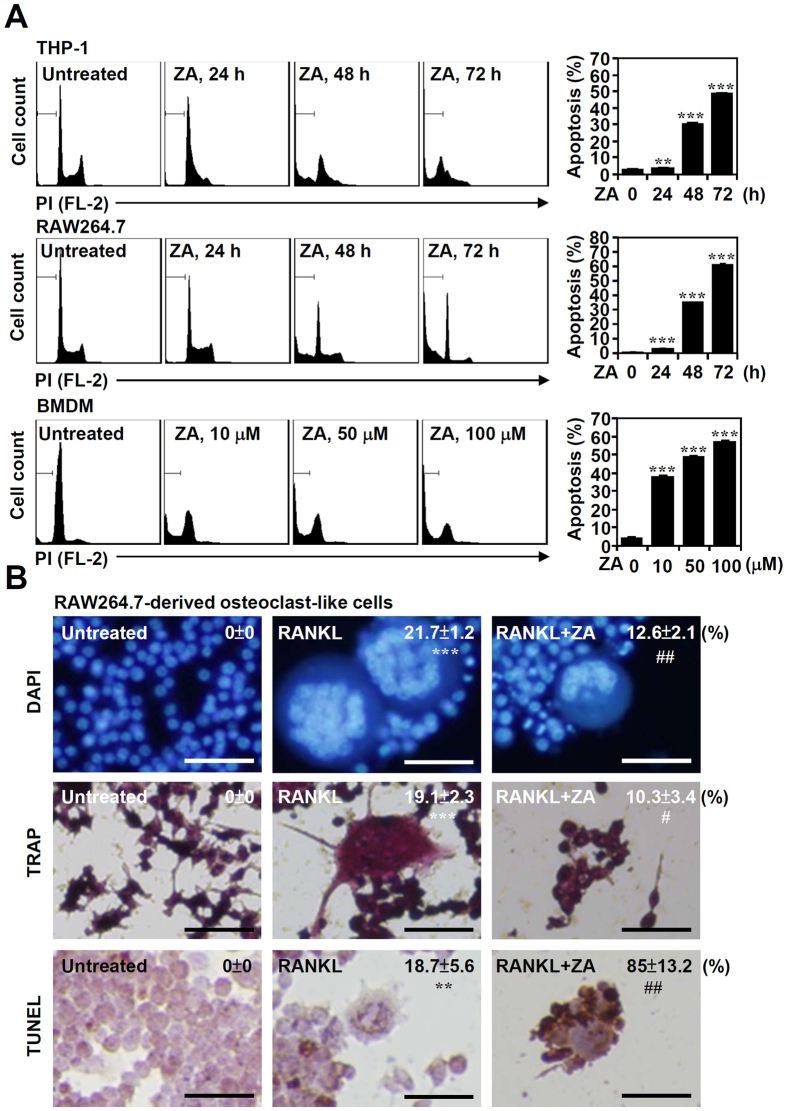
Figure 1. ZA treatment induces apoptosis in monocytes, macrophages, and differentiated osteoclast-like cells.
(A) THP-1 and RAW 264.7 cells were treated with ZA (100 μM) for the indicated time. BMDMs were treated with different doses of ZA as indicated for 48 h. A representative histogram obtained from PI staining followed by flow cytometric analysis indicated the proportion of cells in the sub-G1 phase. The data are shown as the mean ± SD of three individual experiments. ***p < 0.001 compared to untreated cells. (B) RAW264.7 cells were pre-treated with RANKL for 6 days followed by ZA (100 μM) treatment for another 2 days. DAPI, TRAP, and TUNEL staining followed by fluorescent and light microscopic observation were used to detect the formation of osteoclast-like cells and cell apoptosis. A representative image obtained from three individual experiments is shown. TRAP staining followed by microscopic observation reveals the differentiation of osteoclasts, which are characterized by TRAP-positive multinucleated cells (nuclei > 3). The percentages of osteoclast-like cells and apoptotic cells are shown as the means ± SD. Scale bar = 50 μm. **p < 0.01 and ***p < 0.001 compared to untreated cells; #p < 0.05 and ##p < 0.01 compared to RANKL treatment.

