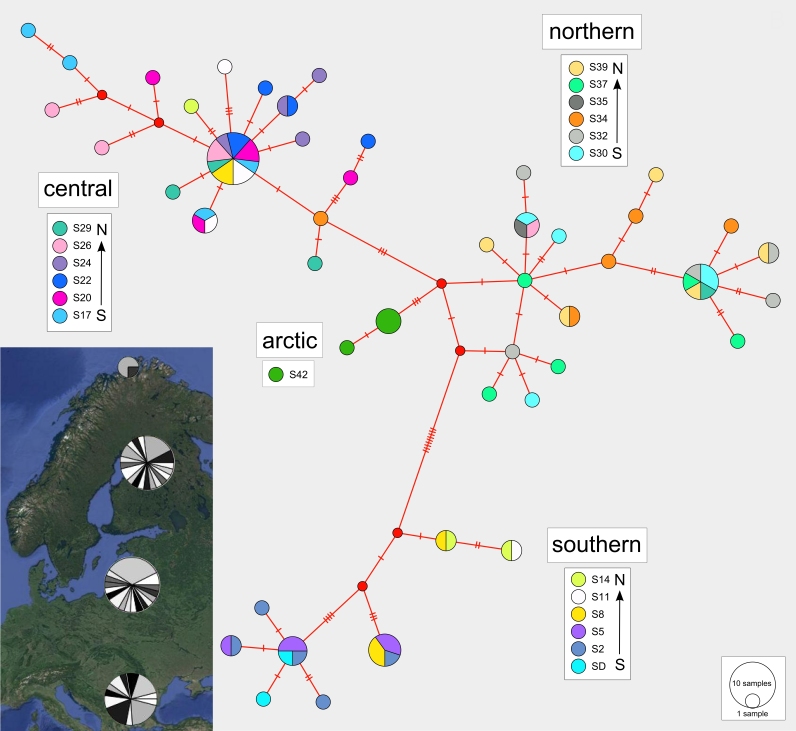
Figure 6.
Median-joining haplotype network with colours indicating haplotype distributions by site. Labelled regions (southern, central, northern, arctic) are determined from a ML clade analysis of the DNA sequence data. Inset: Indication of the proportions of haplotypes represented within each of the four major regions.

