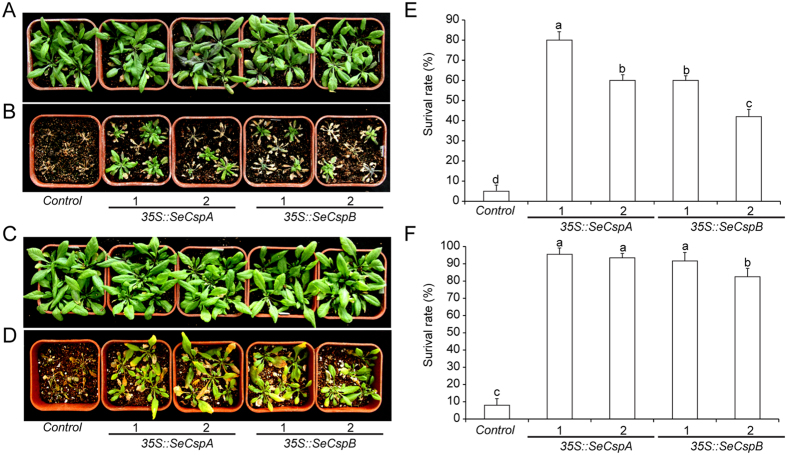
Figure 2. Phenotypes of transgenic Arabidopsis lines and control plants subjected to stress treatments.
(A) and (C) Phenotypes of transgenic Arabidopsis lines under normal condition. (B) Phenotypes after cold stress treatment. Plants were photographed after one week of recovery under normal conditions. (D) Phenotypes of transgenic Arabidopsis lines grown under dehydration conditions for one week. Photographs were taken after one week of recovery under normal conditions. (E) and (F) Survival rates of Arabidopsis lines. Vertical bars bearing different letters in (E) and (F) indicate significant differences at P < 0.05 and error bars represent standard errors.

