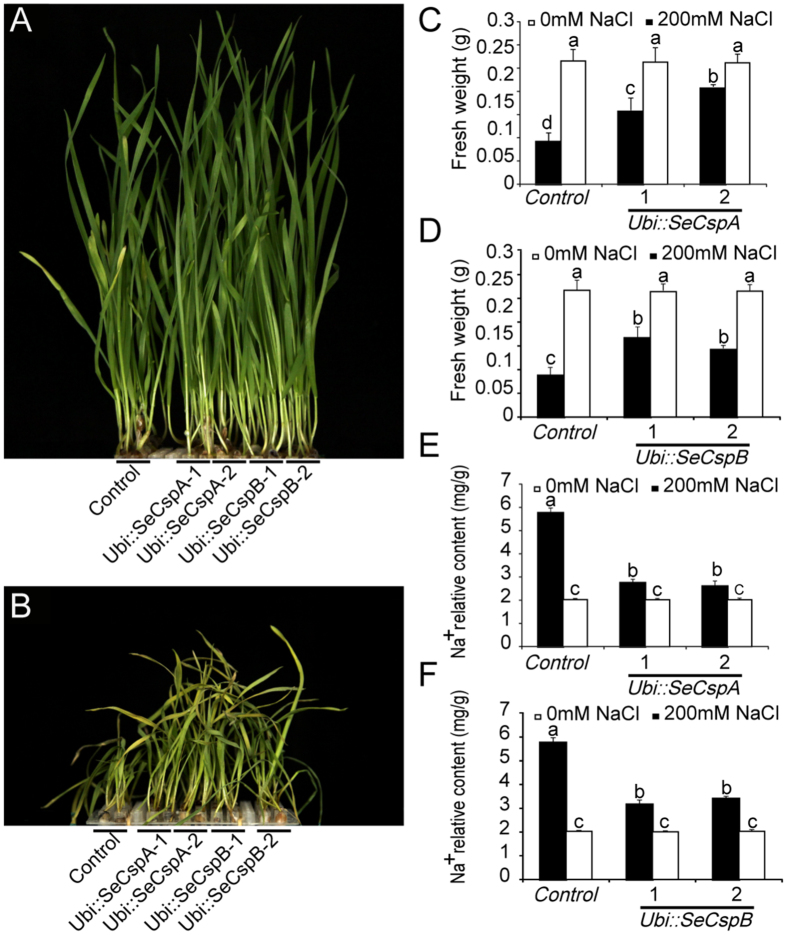
Figure 3. Responses of the transgenic lines and parental wheat line (control) under salt stress.
(A) Phenotypes of transgenic wheat lines grown under normal conditions for two weeks. (B) Phenotypes of transgenic wheat lines grown under high-salt (200 mM NaCl) stress. (C) and (D) Fresh weights of the transgenic wheat lines and control wheat lines. Measurements were made after 7-day-old plants were treated with NaCl for one week. (E) and (F) Relative Na+ content. Measurements were made after 7-day-old plants were treated with NaCl for 6 h. Vertical bars bearing different letters in (C,D,E), and (F) indicate significant differences at P < 0.05 and error bars represent standard errors.

