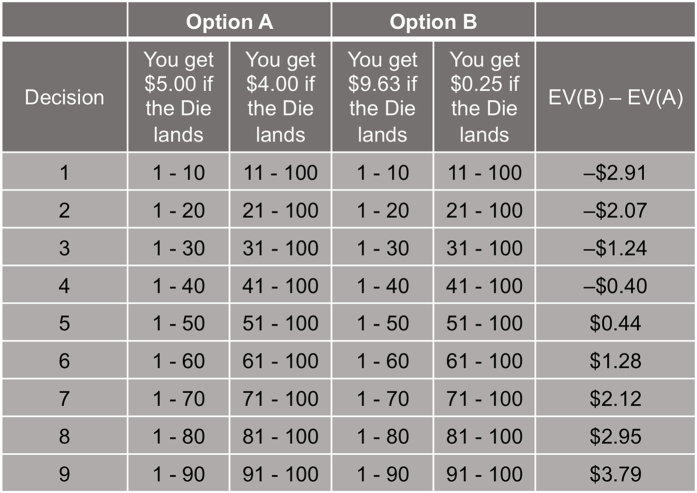
Figure 1. Payoffs and probabilities of paired gambles.
Participants played a gambling task that consisted of a menu of probabilities of high- and low-payoff values. As per Holt & Laury8, participants made nine choices between two risky gambles ‘Option A’ and ‘Option B’. The high- and low-payoff assigned to each option were fixed as shown here. The probability associated with payoff values was represented as a range of numbers; this allowed participants to easily match the probability of each outcome with a roll of a hundred-sided die; this roll was performed after the task for one randomly selected gamble to determine the final outcome for payoff. The rightmost column shows the expected value differences between the Option A and B. Expected utility theory predicts that a risk neutral individual will choose Option A in decisions 1–4 where EV(B) <EV(A) and Option B in decisions 5–9 where EV(B) > EV(A).

