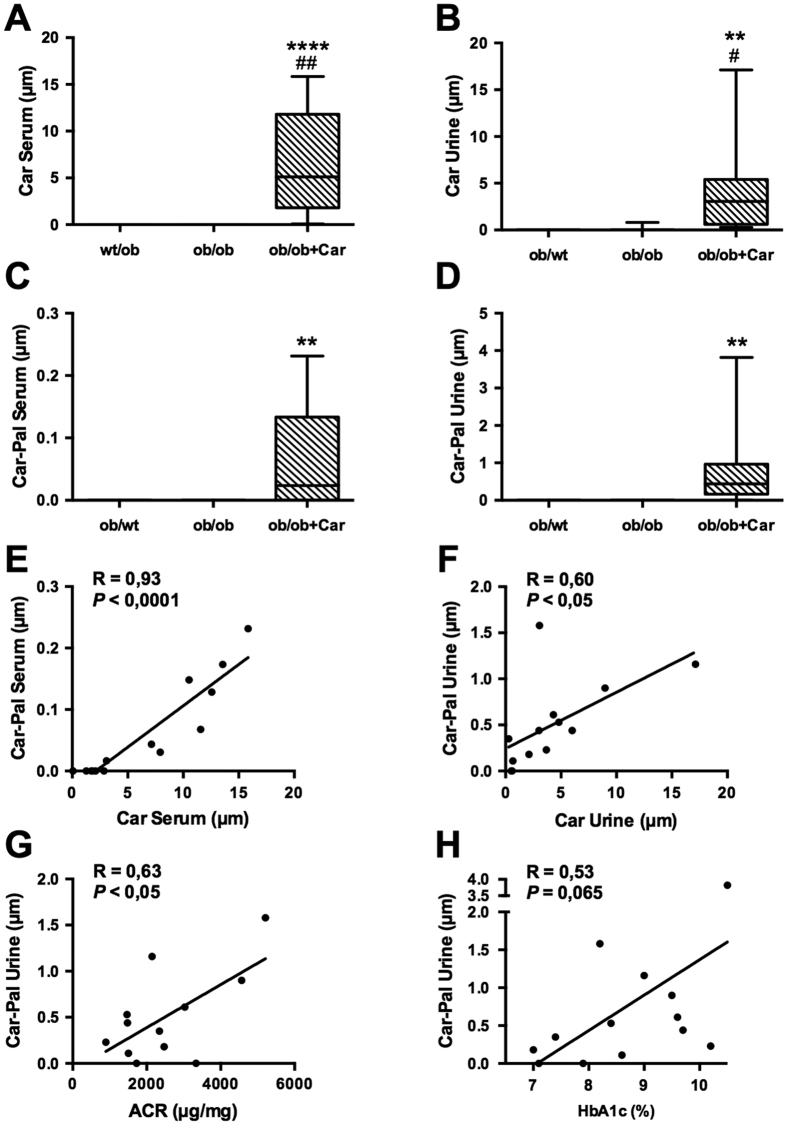
Figure 8. Carnosine and its acrolein adduct are increased in serum and urine of treated mice.
(A–D) Carnosine and carnosine-propanal levels are significantly increased in the serum and urine of treated mice compared to ob/ob mice (data are depicted in a box plot with whiskers extended to minimum and maximum values). (E,F) Carnosine levels in serum and urine of treated mice significantly correlated with the respective adduct levels in the same specimen. (G,H) The ACR of treated animals significantly correlated with urinary carnosine-propanal. HbA1c levels showed a similar trend, but this correlation was not statistically significant (P = 0.065). ****P < 0.0001, **P < 0.01 compared to ob/ob mice. ##P < 0.01, #P < 0.05 compared to wt/ob mice. Car: carnosine; Car-Pal: carnosine-propanal.

