Figure 4.

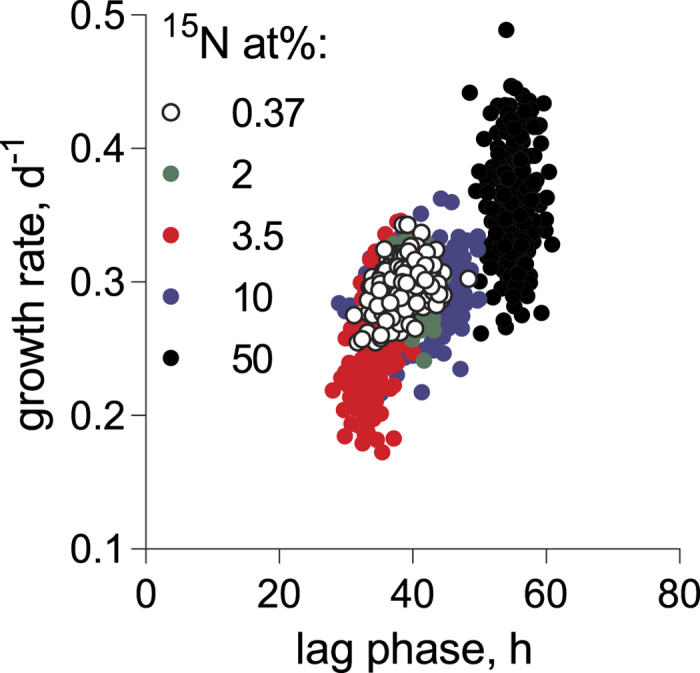
Relationship between maximal growth rate (μ, d−1) and duration of the lag phase (λ, h) in R. subcapitata exposed to 0.37 to 50 at% 15N.

Relationship between maximal growth rate (μ, d−1) and duration of the lag phase (λ, h) in R. subcapitata exposed to 0.37 to 50 at% 15N.