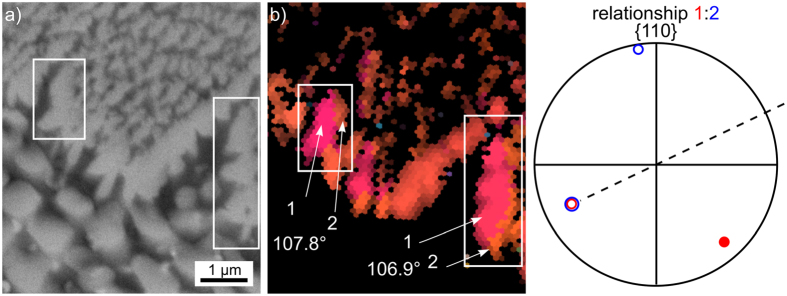
Figure 12.
(a) SEM-micrograph and (b) IPF- + IQ-map containing only data points of β-YS of the area in frame 2 in Fig. 11. The relationship between the orientation domains 1 and 2 is illustrated in the {110}-PF and the misorientation angles between the respective domains are stated below.

