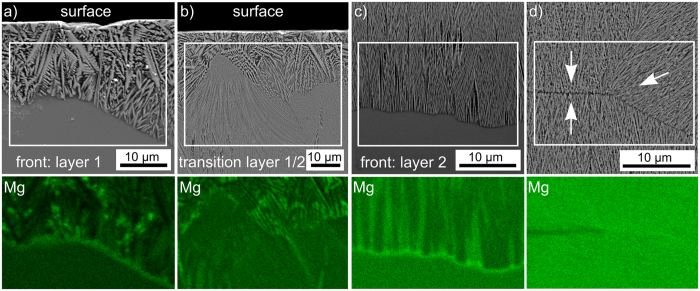
Figure 16.
SEM-micrographs of (a) the growth front of layer 1, (b) the transition from layer 1 to layer 2, (c) the growth front of layer 2 and (d) the collision zone of growth fronts of layer 2. The arrows highlight the respective growth directions. EDS-maps of the relative Mg distribution in the framed areas are presented below the respective figures.

