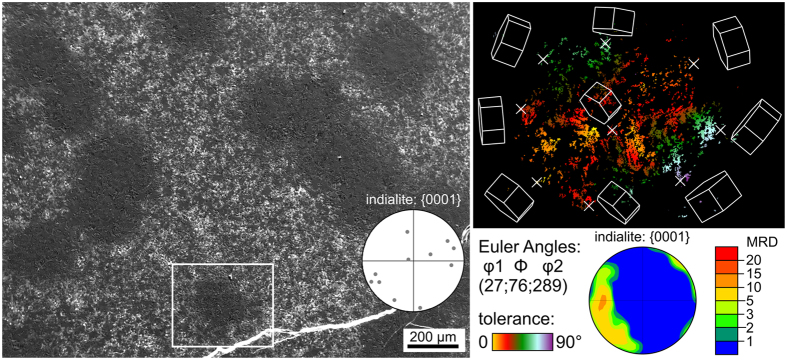
Figure 3. SEM-micrograph of the immediate surface after the sample was crystallized at 950 °C for 5 h, cooled to RT and then annealed another 1 h at 1060 °C.
The {0001}-PF of indialite contains the pole positions of 11 single EBSD-patterns acquired from different circular areas in the micrograph. An orientation map containing only data points attributed to indialite in an EBSD-scan performed on the framed area is presented to the right along with the wire frames of indialite unit cells of selected positions marked by crosses. The {0001}-PF of a texture calculated from this data set is also presented.

