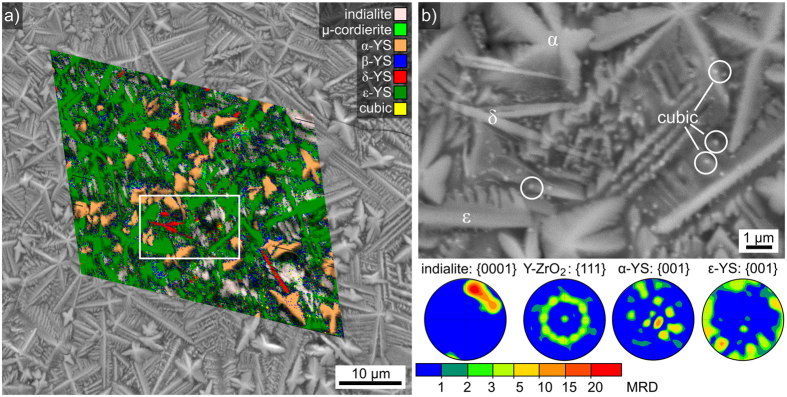
Figure 4.
(a) SEM-micrograph of the immediate surface after the same annealing procedure featured in Fig. 3. It is superimposed by the phase map of a performed EBSD-scan. The framed area is presented in detail in the SEM-micrograph (b) which illustrates the morphology of the clearly discernible phases α-YS, δ-YS, ε-YS and the cubic phase. Pole figures of textures calculated from the data of selected phases are presented below.

