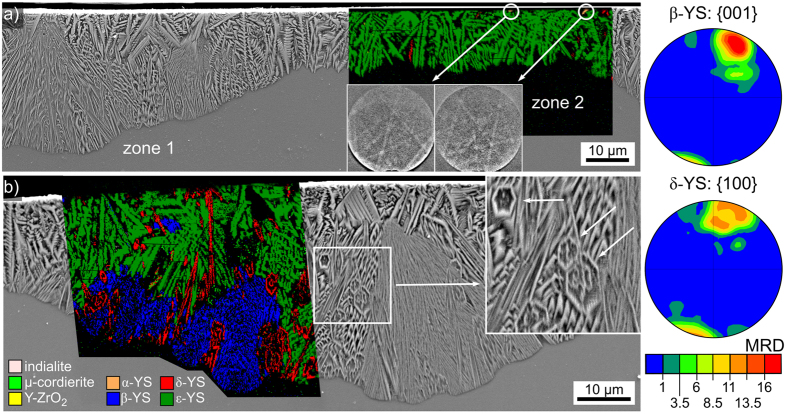
Figure 6. SEM-micrographs of the surface crystallized layer in a cross section after crystallization at 950 °C for 5 h superimposed by phase maps of EBSD-scans performed on the respective areas.
(a) Zone 1 and zone 2 with a phase-map focused on zone 2 which only contains ε-YS with a few δ-YS grains. The two single patterns obtained near the edge to the initial surface originate from α-YS. (b) Focus on zone 1 which contains significant amounts of β-YS and δ-YS in addition to ε-YS. PFs of textures calculated for the datasets of β- and δ-YS in this scan are presented to the right.

