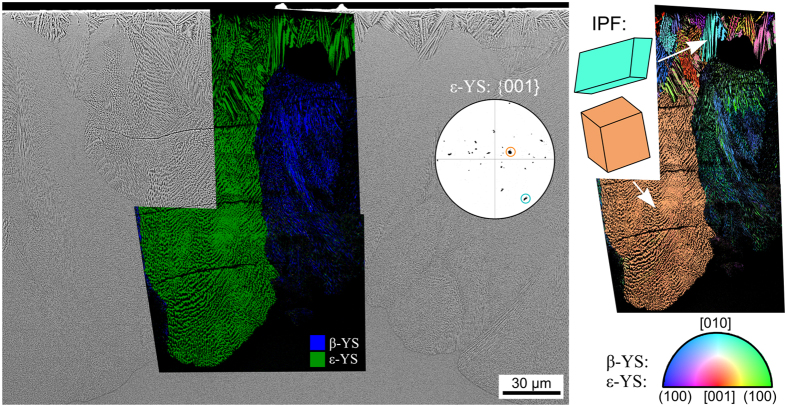
Figure 7. SEM-micrograph obtained from the surface crystallized layer in a cross section after crystallization at 950 °C for 10 h superimposed by the phase + IQ-maps of EBSD-scans performed on the area.
The IPF + IQ-maps of these scans are presented to the right along with unit cells indicating selected ε-YS orientations. These orientations are also highlighted by colored circles in the {001}-PF of ε-YS which is presented to further visualize the orientations of this phase occurring within the scanned area.

