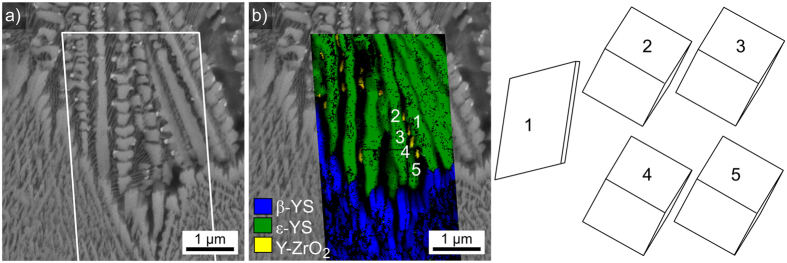
Figure 9. Detailed analysis of the boundary between the growth layers 1 and 2 presented in Fig. 8c.
(a) SEM micrograph, please note the small, bright phase at the tips of the dendrites. The framed area was scanned by EBSD. (b) phase + IQ-map of the performed EBSD-scan. The presented unit cells visualize the orientations of 1: the dendritc arm of ε-YS and 2–5: the respective Y-ZrO2 particles.

