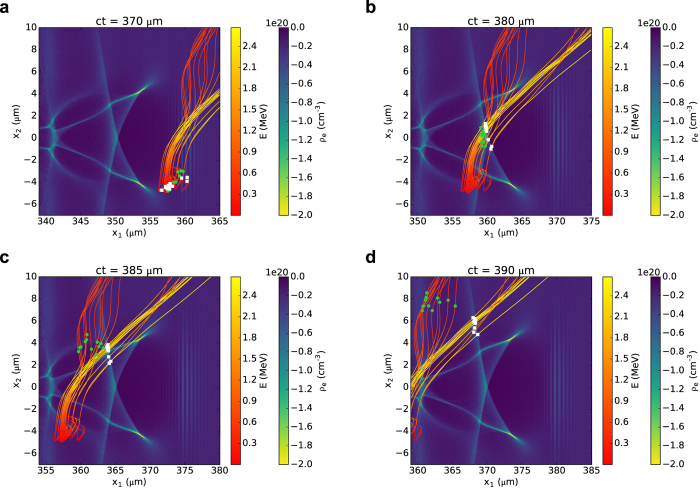
Figure 1. Snapshots of the electron density distribution produced behind an intense laser pulse propagating along the x1 direction in a plasma.
Curves correspond to sample trajectories of electrons ejected at wide angles, with the line colour representing the electron energy. The symbols show the position at the given time of electrons streaming close (white squares) and further away (green circles) from the accelerating structure (bubble) interior.

