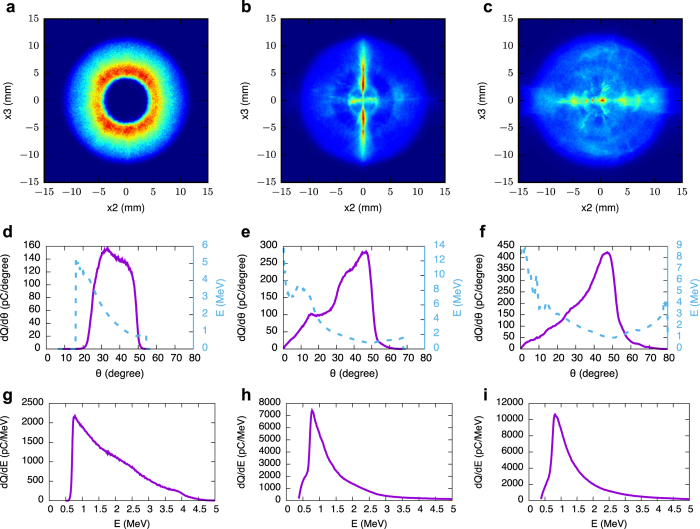
Figure 2.
3D PIC simulations of spatial (a–c), angular (d–f) and spectral (g–i) distribution of oblique electrons on a screen 10 mm downstream from the plasma. The laser intensity and spot size are a0 = 2, w0 = 5 μm (left column), a0 = 2, w0 = 7 μm (middle column) and a0 = 3, w0 = 7 μm (right column). Dashed curves in Figures (d–f) show the energy dependence on angle. Further examples are given in the Supplementary Section.

