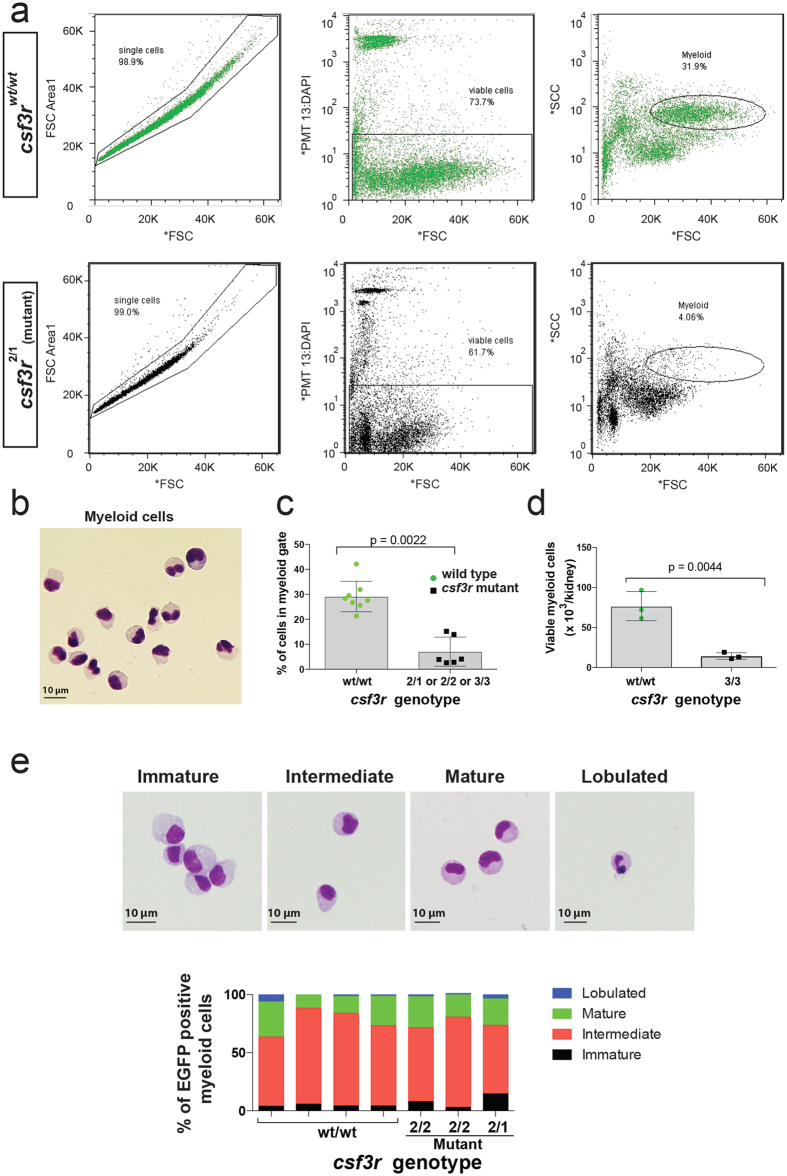
Figure 5. Reduced granulopoiesis in csf3r null kidney marrow.
(a) Representative examples showing gating strategy on single and viable cells, and forward/side scatter profiles (FSC ad SSC) displaying reduced number of cells in the myeloid cell gate of csf3r-mutant kidney marrow cells compared to wildtype (WT). Supplementary Fig. S3 provides this information for all samples contributing to data in this figure. (b) May Grünwald-Giemsa stained cytospin of WT myeloid gate cells. (c) Percentage of viable cells falling within myeloid gate, which is significantly reduced in csf3r−/− mutant kidney marrows. Points represent different animals. Data are mean ± SD; p-value from Mann-Whitney test. n = 8 animals (WT) and 6 (mutant). (d) Number of viable myeloid cells/kidney, which is significantly reduced in csf3r−/− mutant kidney marrows. Data are mean ± SD; p-value from unpaired, 2-tailed t-test. n = 3 animals/group. (e) Four-category neutrophil differential counts based on the categories illustrated (top row of panels) in WT (n = 4) and csf3r−/− mutant (n = 3) kidney marrow cells, demonstrating no marked difference.

