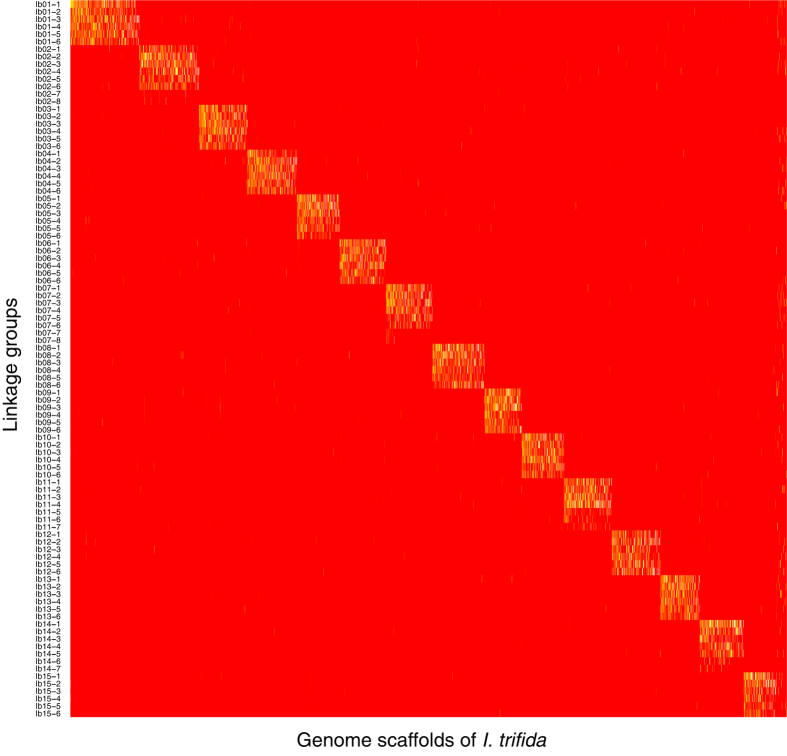
Figure 3. Homologous groups based on physical mapping of the linkage groups onto the I. trifida genome scaffolds.
Presence and absence of assignments of SNPs on the scaffolds are indicated by yellow and red intersections, respectively, between the linkage groups (vertical axis) and genome scaffolds (horizontal axis).

