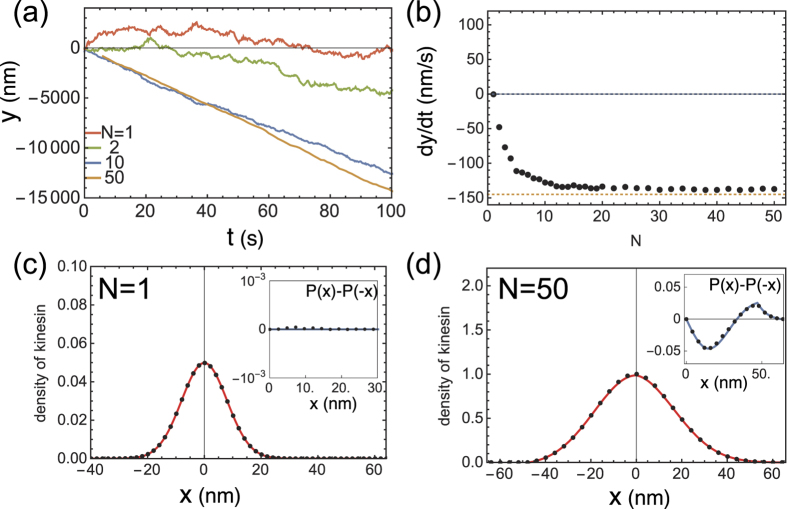
Figure 4. Behavior of model with asymmetric strain-dependent detachment for v0 = 0 [nm/s].
(a) Time series of filament coordinate y for varying N. (b)  dependency on N. Both (a,b) illustrate the directionality transition with increasing N. The upper and bottom dashed lines in (b) indicate theoretical estimates for N = 1 and for sufficiently large N, respectively. (c,d) show the x distribution P(x) for N = 1 and 50, respectively. The lines and dots represent theoretical estimates and simulation results, respectively. In the inset, the difference in P(x) for x > 0 and x < 0, i.e., P(x) − P(−x), is plotted to make the asymmetry in P(x) clearer The following parameters are used: v0 = 0 [nm/s]; Dx = 3 × 10⁴ [nm2/s]; Dy = 4 × 10⁴ [nm2/s]; κ = 1000 [s−1] (k = 0.1 [pN/nm] and γy = 10−4 [pN · s/nm]); Δ+ = 64 [nm]; Δ− = 48 [nm]; r = 20 [s−1];
  ; and a0 = 90 [s−1].

